The twenty-first century moon shot
On May 25, 1961, President John F Kennedy talked about putting a person on the moon and said these very influential words.
So we choose to go to the moon in this decade and to do other things, not because they are easy, because they are hard.
To the people listening to Kennedy’s speech in 1961, the idea of a moon landing seemed like something out of a science fiction movie. But on July 16, 1969, Neil Armstrong set foot on the moon. The nearly unreachable had been accomplished. When people conceive of something so out of reach, so challenging, they refer to it as a moon-shot.
Today, our moon-shot’s greatest challenge is producing carbon-free electricity by 2050. So why is this a moon shot? The US Department of Energy (DOE) lays it out explicitly. See Figure 1.

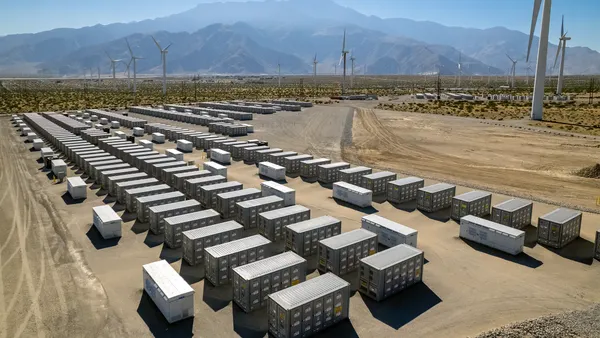
Figure 1 shows how much clean energy the US will need to meet the 2050 zero-carbon electricity goals. It indicates that in 2020, we have wind capacity of 120 Gigawatts (GW). Solar comes in at 89 GW and other renewables at 210 GW. By 2050, the US will require nearly ten times that capacity. And since wind and solar are variable energy sources, we will need 1680 GW of storage. The DOE notes that we have virtually no significant storage capacity today.
We can’t make the same mistakes of the past
A major process of this massive infrastructure build will be siting. That’s where location technology in the form of GIS is critical. It provides the data, the analysis, and the communication and collaboration processes. This will ensure that in our zeal to build quickly, we don’t make the mistakes we have done in the past. Mistakes include building in areas that are subject to natural disasters. Disasters include sea rise, areas prone to earthquakes, landslides, flooding, drought, and more. Mistakes also include not taking into effect the future impact of climate change,
The common misconception about GIS is that it automates mapping. It does much more. It uncovers impacts that we wouldn’t see using usual planning tools. It finds hidden consequences. Its analytical capabilities have been used for decades. It finds the right locations to build businesses as varied as power plants, electrical substations, transmission lines, geothermal facilities, coffee shops, and grocery stores. Likewise, it discovers the right places to locate what will be needed to meet America’s sustainability goals.
Two key tools include Esri’s Living Atlas of the World and ArcGIS Business Analyst. Together they guide planners to provide extensive data about the land, hazards, demographics, traffic patterns, and business metrics.
As we build tenfold the number of solar, wind, and clean storage facilities, we must not cause unintended consequences. We cannot negatively impact vulnerable communities or the environment. We must protect clean water supplies, vegetated wetlands, and valuable vistas for future generations.
To ensure we plan correctly and don’t make the same mistakes we did in the past, planners use a concept called Geodesign.
Here are the elements of Geodesign:
- Combines geography with design by providing designers with robust tools that support rapid evaluation of design alternatives against the impacts of those designs.
- Infuses design with a blend of science- and value-based information to help designers, planners, and stakeholders make better-informed decisions.
Globalization, population growth, climate change, and increasing resource demands are serious problems. With Geodesign concepts, planners can see the impact of their designs. Planners can see designs both good and not-so-good, well in advance of permitting, engineering, and construction. It also provides a convenient way of communicating what the future will look like for public policy managers and the public, given the scope of change anticipated to meet the sustainability goals in the energy sector, the more communication, the better.
Modeling social equity
Our past is littered with social missteps. One notable example is the west side of Manhattan, called San Juan Hill. It was eliminated to make room for the Lincoln Center for the Performing Arts. Over 7000 people of low and modest income were displaced. The devastation of this neighborhood was the setting for the landmark musical, West Side Story.
As the zeal to increase interstate highways increased in the 1950s, the impact of the construction and subsequent pollution was mostly felt by low-income people.
Part of the problem was the lack of a science-based approach to modeling social equity.
This storymap explains in detail how spatial technology models social equity. It illustrates the impact of electrical outages on vulnerable communities. Figure 2 shows how GIS maps various equity groups by area. Groups include people of color, the elderly, low-income, people with disabilities, renters, and more. In addition, the dashboard shows areas of different vulnerabilities. This allows planners to see the impact of projects from a positive perspective, such as the availability of charging stations. It also shows a negative view, such as the taking of land and homes and the displacement of vulnerable populations.

GIS is not just about making maps. It is about measurement, data management, visualization, analytics, and decision making. Before we embark on this major moon-shot initiative, we must have a solid understanding of the impact on all of society.
GIS helps us think differently about sustainability
What exactly is sustainability? Sustainability provides for our needs today but does not compromise future generations’ needs. So that means we must ensure that what we plan for today solves our immediate problems and assures that our children and their children do not bear the brunt of our short-sightedness.
One of the most powerful things about GIS is that it helps us to think differently. It has two main components. First, it provides the content – the data – the digital representation of the assets, pieces, and parts that make up our energy supply system. Second, it provides the context – the relationships and insights that provide true digital transformation.
Digital transformation is more than converting something from analog to digital or scanning paper documents. For example, think about how we consume movies and media today. We migrated from VHS to DVDs, but it wasn’t until we got streaming videos that we completely changed how we watched movies. Digital transformation requires both a change in technology and a change in behavior, leading us to change how we view the world.
GIS helps us to do just that. How? It allows us to see patterns hidden from our view. It provides visualization and analytic tools, such as combining geographic knowledge with machine learning. This unlocks the secrets that we could never see before. Secrets that guide us into a sustainable future.
Three strategies of a sustainable energy system
The three strategies are:
1) Siting green energy and storage facilities
2) Delivery systems to take the energy from where it is produced to where it is needed
3) Decarbonizing our usage patterns
Siting green energy and storage facilities
As noted by the DOE, the most obvious strategy is the whopping increase in green energy production and storage facilities. However, this is all about developing siting on a whole new level. Location technology examines hundreds of factors that go into siting. For example, it leverages available land, topography, natural barriers and resources, zoning, aesthetics, population centers and migration, economics, weather, and traffic patterns. In addition, it leverages remote sensing and analyzes imagery to discover the best location for solar and wind resources.
Figure 3 shows how location technology can be used to identify the visual impact of a potential solar farm.

Delivery of green energy
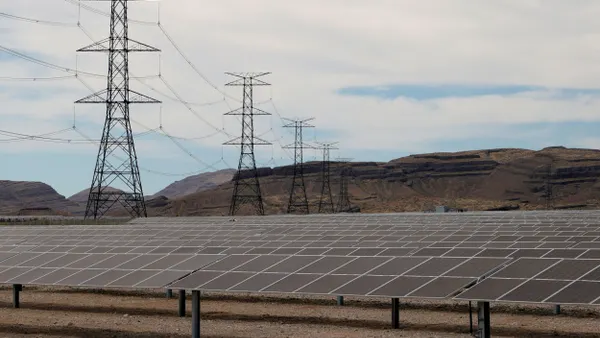
Creating green energy is a major challenge. Delivering it is another. Major green energy resources are in remote areas. Huge wind and solar resources exist in the northern and western parts of the United States. Moving it to where it is needed will require substantial investment in new and expanded grids.
The DOE’s, Building a Better Grid Initiative is part of the Infrastructure Investment and Jobs Act (IIJA), funded at 16 and a half-billion dollars. Part of the funding will go to planning grid routes from renewable energy sources, such as off-shore wind farms to existing grids. GIS is critical for the grid’s assessment, design, and construction. The same technology can apply to pipelines to capture carbon from power plants and route new renewable and hydrogen pipelines.
Figure 4 details how GIS finds the best possible transmission route from the site of a green renewable energy source to the nearest grid connection.

Decarbonizing our usage patterns
We know that the largest percentage of greenhouse gases comes from transportation. According to a study by Bloomberg, in 2022, the global use of internal combustion engine vehicles peaked. The global fleet of passenger vehicles is 1.25 billion, the highest it has ever been. The move to electric vehicles (EVs) will not be easy. Fortunately, all automakers are quickly moving in the direction of EVs. In addition, some states are considering banning the sale of gas power cars. However, the challenge, and we could argue that this is a moon-shot challenge, is to build the infrastructure to manage the massive amount of power needed to replace the energy currently supplied by gas stations.
The Infrastructure Investment and Jobs Act is a big step forward in this massive migration. At the end of five years, the goal is to have ½ million public charging stations in the US. Of course, not all will be fast chargers, but it will be a big step forward.
GIS could also be used to determine the best location for EV charging stations. It brings in many data layers, including gas stations, level 1, level 2, and DC fast charging stations. It also identifies heavy traffic patterns. It illustrates where there is insufficient electrical capacity. Finally, it highlights areas of social equity risk. This analysis allows planners to optimize the location of EV charging stations while satisfying the IIJA requirements of social equity.
This analysis will be critical for utilities as they attempt to meet the demand for migrating gas-powered cars to EVs. That, too, will be a moon shot for utilities. Planners can use the same technology to roll out hydrogen, renewable natural gas, and low-emission natural gas fueling stations.
Summary
Given the volume of green power needed to migrate our transportation systems and manufacturing, we need to create more efficiency in all aspects of our energy use. In addition to adding electrical load, we must figure out how to apply additional energy efficiency technologies to reduce the use of energy without compromising necessity and comfort. GIS can help identify where there are excessive demand and target conservation programs.
To reach our goals, our moon-shot, we simply can’t just improve what we have been doing. We need to think differently about process and technology. We also must transform our energy supply system using the lens of social equity. We need to see things that we haven’t been able to see before. We must evaluate our past missteps. Seeing thing spatially provides a different view, a new perspective, revealing new patterns and hidden relationships. GIS is not just about making maps, but uncovering secrets buried in data. It’s about changing the way we view the world to make it sustainable for us. And those we hand this planet to.

