What is Grid Quadremma? It’s a made-up phrase but implies a four-pronged dilemma when applied to the US grid. The first is the decarbonization of power generation. According to the US Energy Information Administration, today’s generation capability is about 1.3 gigawatts. Fossil fuel produces about 60% of that generation. To decarbonize, the US must substitute that 60% with green energy. That’s assuming the demand in 2050 is the same as today. But it won’t be.
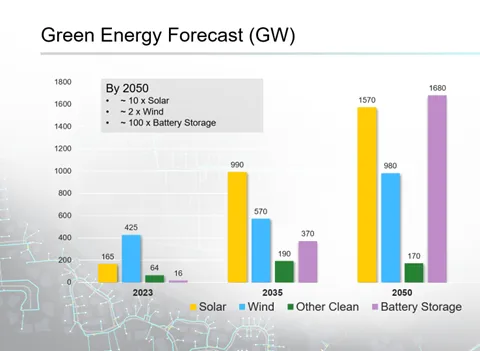
The graphic below dramatically illustrates the challenges of green energy production. If projections come true, the US will require ten times the amount of solar energy, 100 times the storage capacity, and two times the wind power.
The second prong of the quadremma is the demand for electricity, which will grow by 2050 due to the decarbonization of the transportation sector: planes, trains, and automobiles. And trucks and ships. Customers will convert to electric heat using advanced heat pumps. There is also a surge in demand from data centers, pumping out AI solutions.
The third prong of the quadremma is that an aging, congested, and fragmented grid will have to transport all the energy.
“The grid is already a critical element of our energy system,” said Matteo Muratori, a National Renewable Energy Laboratory analyst. “But it’s going to become the central piece of the future energy system.”
“Yet, today’s grid cannot adequately support 21st-century challenges – including the integration of new clean energy sources and the growing transportation and building electrification – while remaining resilient..”DOE Transmission Needs Study October 2023.

The distribution system was never designed for two-way power flow. Further, assume every house in a standard subdivision has an EV and plugs them in simultaneously. The result is that most of the existing distribution transformers will be overloaded. Add the demand for electric stoves, water heaters, dryers, heating systems, or whatever new gadget emerges during the next decade, and the situation will worsen.
The fourth prong is extreme weather, including storms and wildfires. The congested grid does not allow easy power transfer from areas that need it during increased demand. Finally, the grid limits low-cost power to reach high-cost power areas due to bottlenecks in the grid. Some low-cost power plants must curtail power production due to the inability to reach high-demand markets.
The Electric Industry Needs Better Network Modeling
Given the huge challenges the industry faces over a relatively brief period, the industry needs a technology framework for dynamic planning, analysis, and real-time operation of the future grid. It must fully support renewable energy integration, resiliency improvements, and efficiency increases. They need to be smarter.
GIS provides the framework to bring together essential elements of the electric sector. People viewed GIS as automating the old manual mapping process. Today’s modern GIS is so much more. It combines disparate technologies for faster response to issues and crisp investment decision-making. Why? Location is a common element in everything the energy business does.
GIS answers many difficult questions:
- Where are transmission lines most congested?
- What areas are wholesale power prices higher, and why?
- Where will customers install DER next year?
- Where will flexible ancillary services help maintain system balance?
- Where will incentive programs be most successful?
- Where will electric vehicle charging be required?
- Where will two-way power flows affect system protection?
GIS uncovers hidden relationships and patterns to help energy professionals plan for the future grid.
Better Models, Accurate Data, Ease of Communication
One of the many capabilities of modern network management is the ArcGIS Utility Network. It accurately represents today’s complex networks in three dimensions and time with high performance and scalability.
FirstEnergy, one of the largest electric utilities in the United States, recently completed a multiyear modernization project. It replaced its older GIS by migrating to ArcGIS Utility Network. A key was making the design process easier. Given the huge amount of work needed to upgrade the grid, FirstEnergy staff needed to update their distribution design workflows with modern tools. It needed to simplify the engineering process for designers. FirstEnergy staff simultaneously deployed ArcGIS Utility Network and Distribution Design Studio (DDS) by GeoSpatial Innovations Inc., an Esri partner, for a comprehensive design workflow.
Learn more about how FirstEnergy implemented modern network management here.
GIS Supports Efficiency
How? It distributes actionable network data to stakeholders, the modern workforce, and other digital systems. It uses cutting-edge web services that are responsive to changes and exposes capabilities to other systems. It does this by sharing data between mission-critical systems such as ERP (Enterprise Resource Planning), CRM (Customer Relationship Management), ADMS (Advanced Distribution Management, AMI (Advanced Metering Infrastructure), and SCADA (System Control and Data Acquisition).
The utility Veitur, headquartered in Reykjavík, Iceland is another example of moving to modern network management using GIS. It serves provides district heating, water, sewer, and electricity. Veitur’s internal GIS team is migrating its electric distribution data to ArcGIS Utility Network. Ívar Hrafn Ágústsson, a Control System Specialist, Veitur stated it well, “Utility Network has the potential to streamline our processes and workflow, as it greatly increases the possibilities to integrate with other systems where Utility Network becomes the master data system.”
Turlock Irrigation District (TID) provides another example of moving to modern network management. TID provides the Central Valley of California with reliable irrigation water and power. Recognizing factors for demand impacts in the coming years and needing to maintain reliability during droughts, TID wanted a network modernization roadmap to prepare for the future.
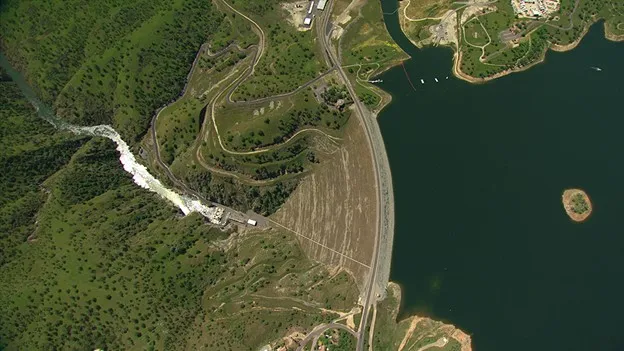
TID needed to analyze load flows more effectively and predict future water and power network conditions. Engineers spent months preparing accurate data models for subsequent system analysis. As a result, manual data adjustments were often necessary to overcome limitations that further degraded the model’s fidelity. TID needed better insight into its networks to support advanced network modernization applications.
TID selected POWER Engineers, Incorporated (POWER), another Esri partner, to help. TID developed a network modernization roadmap. The roadmap provided recommendations for modernizing its technology infrastructure to accommodate future impacts on the utility’s water and power networks. It chose the ArcGIS Utility Network as the basis for modernizing its systems.
Learn more about TID’s Network Modernization.
Analytics Drive Critical Decision-Making
Once ArcGIS collects data from various sources, it adds significant value using spatial analytics. ArcGIS does more than just present data. Spatial analysis uncovers patterns and trends that simple visualization cannot.
Mid-South Synergy in Texas shared one example of using analytics to improve resilience. It removes tree hazards as part of its normal electric operations. Changing conditions necessitated more sophisticated methods. The utility uses state-of-the-art GIS data feeds and spatial analysis to improve its effectiveness.
Examples of how GIS Modern Network Management uses analytics include:
Risk assessment—Risk is vulnerability plus consequences. Spatial analysis addresses both. ArcGIS consumes data from many sources. This includes load flow, short circuit, and stability studies. It uses statistics, science, and big data analytics to find vulnerability. It then examines where that vulnerability will have the greatest negative impact on the network and the community.
Imagery and image analysis processing—ArcGIS processes images to provide insight into the surrounding environment. Spectral analysis and change detection can quickly uncover issues hidden from the naked eye.
Machine learning/Artificial intelligence (AI)—In combination with imagery and video, GIS can uncover imminent failures. Using machine learning, utilities can scan thousands of devices in seconds to locate dangers lurking in their network.
Big data analysis—ArcGIS has built-in tools to manage big data from sensors. It can handle unstructured data from various sources. Modernization goals seek increased sustainability by optimizing clean energy and energy-efficient resources. Spatial analysis adds value by forecasting future activities and better understanding DER variability, transmission congestion, and existing infrastructure optimization.
Data-driven analysis uncovers patterns that feed the best planning decisions. Powerful ArcGIS analytics enables new approaches to network modernization challenges. A recent Federal Energy Regulatory Commission (FERC) Order 2023 called for transmission operators to leverage spatial analysis to cluster the proposed generator interconnections to reduce the backlog of interconnection requests. Many of those requests are for renewable energy generation projects.
GIS Supports the Engineering and Design Process and Operational Awareness
Given the huge number of new generation and grid enhancement projects, utilities, design firms, and developers need integrated tools to speed up their work.
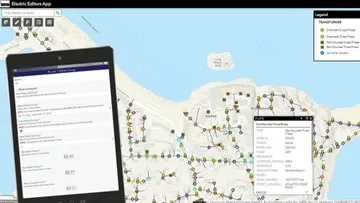
Louisville Gas and Electric Company and Kentucky Utilities Company, part of the PPL Corporation (NYSE: PPL) family of companies, are regulated utilities that serve more than 1.3 million customers and have consistently ranked among the best companies for customer service in the United States. Its challenge was to provide better data for design and mobile users without impacting designers.
To this end, the utilities integrated SBS Automated Utility Design and Utility DataHub with ArcGIS Utility Network. The result was zero end-user disruption with better data to produce high-quality designs.
Operational Awareness
Operational awareness is knowing about what is happening and analyzing its impacts. Sound data and analytics form a foundation to make realistic predictions and gain insights to drive informed grid decisions. Those insights are shared with all stakeholders based on their role for optimal business value.
Modern network management with GIS delivers operational awareness with these capabilities:
Network visualization—An electrical network can be considered the world’s most complex machine. It has millions of elements. ArcGIS fully represents them all—a strategic new capability for deep information access. Utilities can augment network data with rich information sources, adding inputs from smart cities, other utilities, satellites and drones, and traffic services. This kind of information brings an uncommon depth of business insight.
Real-time awareness—The key to operational awareness is timeliness. In addition to the real-world model of the network and its surrounding environment, ArcGIS accesses real-time data to immediately give decision-makers a view of what is going on at any given moment.
Broad dissemination—GIS delivers operational awareness to any device, anywhere, at any time. Truly comprehensive models of utility systems are based on the ArcGIS Utility Network. This model enables smooth data compilation and compelling analytics. When visualized clearly and shared widely, solutions make thriving in a changing industry possible.
Data Quality and Mobility Go Hand in Hand
Data integrity is key to planning, engineering, design, and operational awareness. Migrating to a modern network management solution assures quality and timely data. Data quality is assured by leveraging mobile technology and a data management solution that assures that the data is correct,
Hull Municipal Light Plant leadership looked at ways to improve efficiency and trim costs to keep customer rates low. After discovering inefficient processes and data integrity challenges, it decided it was time for a digital transformation. With a population of just over 10,000, the Boston suburb of Hull, Massachusetts, is most known for its beaches comprising the Nantasket peninsula. Hull Municipal Light Plant staff improved business efficiencies by leveraging ArcGIS Utility Network for a comprehensive utility management system. It partnered with Patrick Engineering to implement ArcGIS Utility Network for a comprehensive utility management system.
As a result, Hull Light achieved its digital transformation. It created a common operating picture, improved data integrity by 80 percent, and enhanced business decision-making by 25 percent.
GIS Supports the Quadremma
How can we beat the Quadremma? How are utilities dealing with increasing costs, skyrocketing customer demands, and decarbonizing both the supply and the demand of energy while strengthening resiliency? The answer: Create a tougher, smarter, more secure, and healthier grid. GIS can help. It provides an understanding of, engagement with, and insight into nearly all dimensions of grid operations.
Learn how GIS helps utilities achieve modern network management with GIS.


