Location matters. Enhancing resiliency is the best way to improve the performance of the energy delivery system during emergencies. Nearly every aspect of utility operation depends on the location of equipment, workers, facilities and all things climate-related. Thus a Geographic Information System (GIS) is the natural tool to help utilities improve resiliency. And prepare for emergencies.
In 2021, US President Joe Biden signed the landmark Infrastructure Investment and Jobs Act (IIJA) into law. The fundamental mission of the law is to rebuild America’s aging infrastructure. That includes the utility grid. Section 40103 of the law focuses directly on resiliency in the Department of Energy program, Preventing Outages and Enhancing the Resiliency of the Electric Grid.
The three R’s
Emergency management is more than a response to a disaster; it is an ongoing process. It begins well before a disaster strikes and continues after the incident. There are three distinct phases to emergency management. They all begin with the letter R:
- Risk Mitigation –identifies the places in the energy system most vulnerable to an emergency.
- Response – this includes the actions utilities take hours before an event, such as a hurricane, to stage crews and material. And this phase includes actions during the event.
- Recovery – this phase involves the arduous process of rebuilding after the event passes.
GIS provides timely, accurate and complete information from various sources. Sound decision-making hinges on rapid data analysis. Sharing that analysis with all stakeholders is just as critical. GIS enables utilities to prepare strategically, respond rapidly and recover methodically.
Taking the chaos out of emergency management
Many processes occur before, during and after a major emergency event. These include decentralizing staff, securing foreign crews, handling material, clearing trees, dispatching, staging and where to provide housing and meals for crews. These tasks all deal with location.
Utilities depend on a whole host of technology such as Supervisory Control and Data Acquisition, network analysis, Outage Management System and several others, all dedicated stand-alone systems. Workers have to stitch together data to form a complete picture of what is happening. GIS creates a way of combining information coming from disparate systems into one place. Location from the GIS ties these systems together.
The greater the danger, the more workers fall back on legacy habits: use of paper, map books, manila folders, pens, pencils, yellow pads and spreadsheets. GIS gives workers a complete view of the situation. It drives utilities to eliminate these old, wasteful habits.
Managing emergency incidents can be chaotic between the plethora of processes, technologies and data. The traditional method is marked by paper maps on the floor, piles of printouts of spreadsheets, and people jammed into conference rooms. The result is a lack of timely collaboration, communication and coordination when they’re needed most. In addition, science-based analytics becomes impossible due to the silos of various activities, different point solutions and manual processes.
Decision-making is tough when people don’t have the data they need at the time they need it. ArcGIS transforms chaos into order. It breaks down silos, providing advanced analytics using tools such as machine learning and augmented reality. GIS delivers situational awareness. It ensures everyone is on the same page and answering the most pressing questions, like what’s going on right now, and how best to prioritize for the greatest recovery impact.
So GIS allows utilities to manage emergencies using the three Rs.
Risk mitigation – building resilience
Fifty percent of electric utility assets in the US are over 30 years old. The average age of gas utility equipment is greater than 35 years old, with more than 50 percent older than 50. Given the enormous challenge of aging assets, utilities must clearly understand where to prioritize their hardening efforts in preparation for emergencies. GIS provides the analytics to prioritize clearly. Greater understanding leads to equitable mitigation strategies through risk analysis based on location. Spatial analysis also aids in assessing equipment needs and developing potential staging strategies for various emergency scenarios. And it helps emergency managers optimize logistics and better navigate today’s supply chain disruptions.
A critical piece of IIJA is to fund activities to reverse the impacts of climate change. For example, one of the impacts is the increase in wildfires, particularly in the western US. CORE Electric Cooperative provides a prime example of using GIS to prepare for and mitigate the impact of wildfires in their pristine territory.
CORE Electric Cooperative serves about 170,000 members across 5,000 square miles along Colorado’s front range. In recent years, Colorado has experienced an increase in the number and size of wildfires. The utility needed to address the trend of increasing damage and personal injuries from wildfires.
CORE leverages detailed location-based information, analytical functions and swift communication to safeguard its stakeholders from wildfire danger.
CORE combines data from the Colorado State Forest Service with the electric network data in ArcGIS. This data includes wildfire risk and burn probability. Using spatial analysis, CORE assigns risk values to electric system components and line segments. Each circuit receives a risk designation. Each line segment and device is tagged with precise information. Detailed risk data helps drive critical mitigation as well as operational decisions.
GIS supports operations staff in capturing data and tracking progress for vegetation management, line inspection, wire replacement, pole inspection and other system improvement efforts.
Building resilience requires careful planning for any emergency. There are three elements needed to prepare for a severe and damaging event. The first is to assess what kind of external impact is likely. The second is to be aware of network capability and vulnerability. Vulnerability assessment requires a solid understanding of where places in the network that need addressing are due to age, failure to upgrade or being in a high-risk area. The third is scenario planning—creating simulations and exercises that test data gathering, analysis and engagement practices.
It’s vital to understand the weaknesses of the network. With that information, utilities can create emergency management plans and scenarios. Places of network vulnerability overlayed with areas of external impacts give warnings of where the most significant damages are likely to occur.
During this process, utilities understand where to focus mitigation efforts, lowering the network vulnerability. It also helps predict equipment needs, staging and supply chain issues. Workers can identify one-of-a-kind materials that would be hard to replace in the event of damage.
Building resilience before an event requires the following:
- Consuming external impact data from as many sources in advance, then using GIS to align that information. Useful data includes demographic, equity, topography and even COVID-19 details.
- Forming a complete model for network vulnerability using GIS spatial analysis. That requires pulling in data from disparate corporate systems.
GIS creates the foundation for the utility emergency management plans, including tactics for foreign crews, staging areas, and backup plans.
Response - making sure all the data and systems are in place
When utilities are faced with an unfolding situation like the discovery of a wildfire, they must have the necessary information infrastructure. This information must be ready at any moment to execute a coordinated and well-planned response using established applications and analytics. These include comprehensive situational awareness dashboards populated with real-time data feeds. Once damage happens, they must craft real-time damage assessment, deploy mobile resources to monitor progress and manage the flow of information. Finally, utilities must be able to ensure a safe and equitable work plan to minimize disruption during the event.
CORE’s response leverages GIS
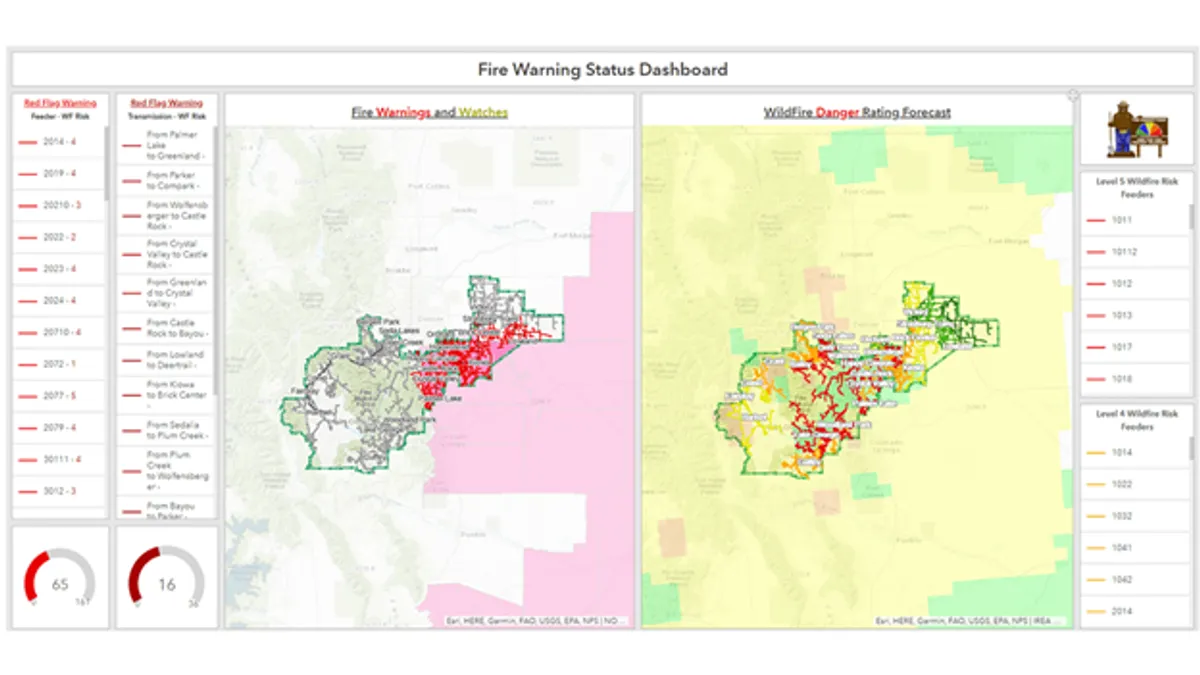
CORE creates wildfire situational awareness by monitoring real-time data feeds. For example, the National Weather Service declares red flag warning days to make wind and humidity forecasts, increasing hazard knowledge. In addition, the National Aeronautics and Space Administration’s (NASA’s) Fire Information for Resource Management System (FIRMS) reports near-real-time thermal anomaly data from satellite observation. Vital real-time information is superimposed on the service territory by using ArcGIS.
CORE leverages Colorado’s Fire Guard notification system and Wildfire Incident Management System. CORE presents warnings and system details with ArcGIS Dashboards and maps. As a result, situational awareness is raised across the organization. Users in the office and the field readily explore conditions in those areas on their displays. The transmission and distribution elements are color-coded based on risk and shown with the seven-day weather forecast.
The utility communicates widely in response to heightened risks or a fire incident. For example, dispatchers email crews and contractors with detailed mapped information. In addition, CORE’s public relations team notifies local agencies, updates the utility’s website and posts on social media using the risk analysis and tracking results.
Throughout any response to a fire incident, the GIS team continually monitors many sources of information. It provides real-time updates on the incident progress to management and the control center.
Recover - rebuild, coordinate and share
Once the event has passed, the utility must begin the rebuilding process. Many customers are without essential services. There may be obstacles such as downed wires, fires still burning or trees obstructing traffic flow. The task ahead can be daunting. The key to optimizing the recovery effort is rapid assimilation of data and close coordination with utility workers, first responders and community officials. GIS helps organize the work by location, monitoring progress and sharing recovery results widely. Utilities must keep track of temporary quick fixes and be precise in reporting material usage for future asset management and record keeping.
Eric Meyer, Electric and Gas Supervising Engineer at Fort Pierce Utilities Authority (FPUA) in Florida implemented ArcGIS to improve their emergency management process. He stated:
“This solution will help modernize and streamline our storm restoration program considerably, allowing FPUA the ability to restore power to our customers quicker than for previous storms. It is our goal that this will help our customers in an urgent time of need and to further fulfill our mission to the community.”
Decisive action with GIS
Emergency management requires a new way of thinking. GIS uses a science-based way of problem-solving that integrates all the available locational information, whether from engineering, equity, facility, real-time, network or environmental data. GIS brings this information together and helps utilities better understand—and predict—critical events.
GIS helps to prepare for and deliver services during and after an emergency. It is an essential component of the 3 R’s of Emergency Management: risk mitigation, response and recovery.
Learn how GIS can deliver results for emergency management here.

