Dive Brief:
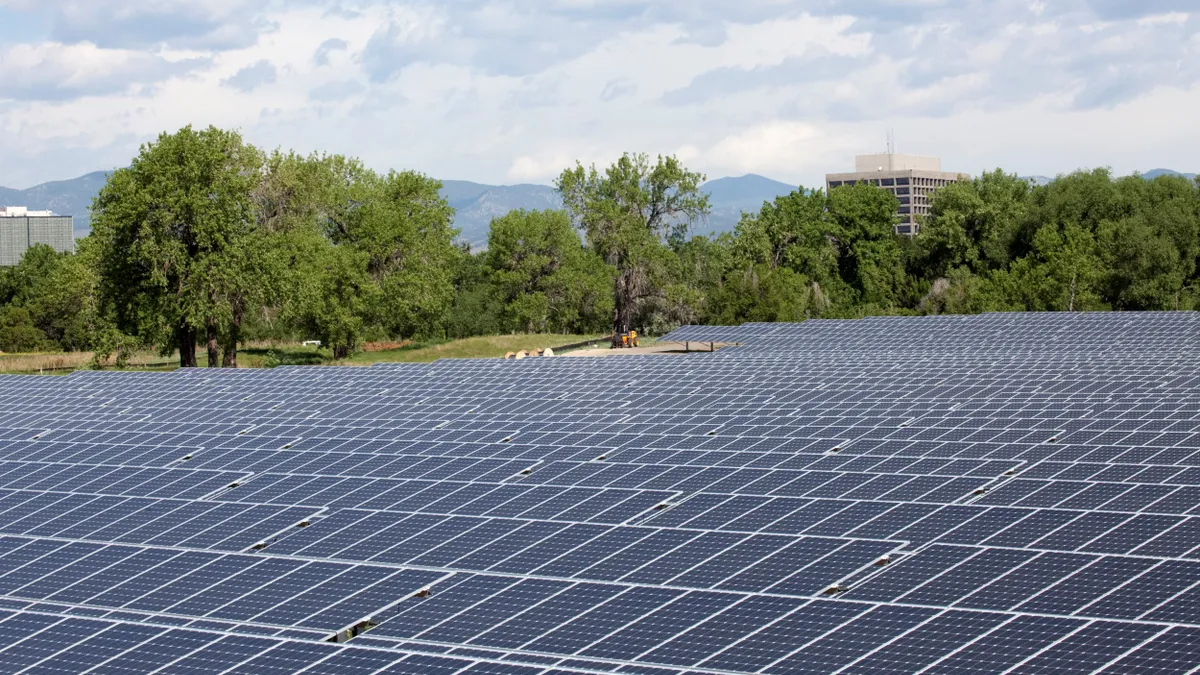
- Utility-scale photovoltaic solar sent 12,303 gigawatt-hours of electricity to U.S. grids during the first 9 months of 2014, up from 6,048 gigawatt-hours in 2013’s first 9 months, according to the U.S. Energy Information Administration.
- The 30% federal Investment Tax Credit, which was established in 2008 and will drop to 10% after 2016, was the key driver behind solar’s growth because it provided long-term stable support.
- The other major factor driving growth was the 70% drop since 2008 in the contract price of solar-generated electricity delivered to the grid. Agreements in 2013 and 2014 were signed at $0.05 per kilowatt-hour, according to Utility-Scale Solar 2013 from DOE’s Lawrence Berkeley National Lab.
Dive Insight:
The 100% growth of solar, which now provides 0.4% of U.S. power, came from new projects and from projects performing above projections.
The $1.6 billion 250 megawatt California Valley Solar Ranch, for instance, was expected to produce 662,000 megawatt-hours per year. In its first year, it generated 697,759 megawatt-hours.
The 70% price drop was driven by economies of scale and solar module market competition.
Without the DOE Loan Guarantee program, there might not have been financing for the first utility-scale installations.
Another key Obama administration pro-solar policy was the cash-grant-in-lieu-of-tax-credits option that sustained the industry through the recession when tax equity evaporated.
The DOE SunShot initiative led to crucial changes in environmental reviews and interconnections that aided growth. State renewables mandates were also important in driving utility-scale solar.
Solar will be 1% of U.S. power by or just beyond the end of 2014 and Environment America estimated it could provide 10% of U.S. power by 2030 if it grows 22% annually, slower than its current pace.
The biggest potential hurdle is in whether Congress will extend the 30% ITC.


