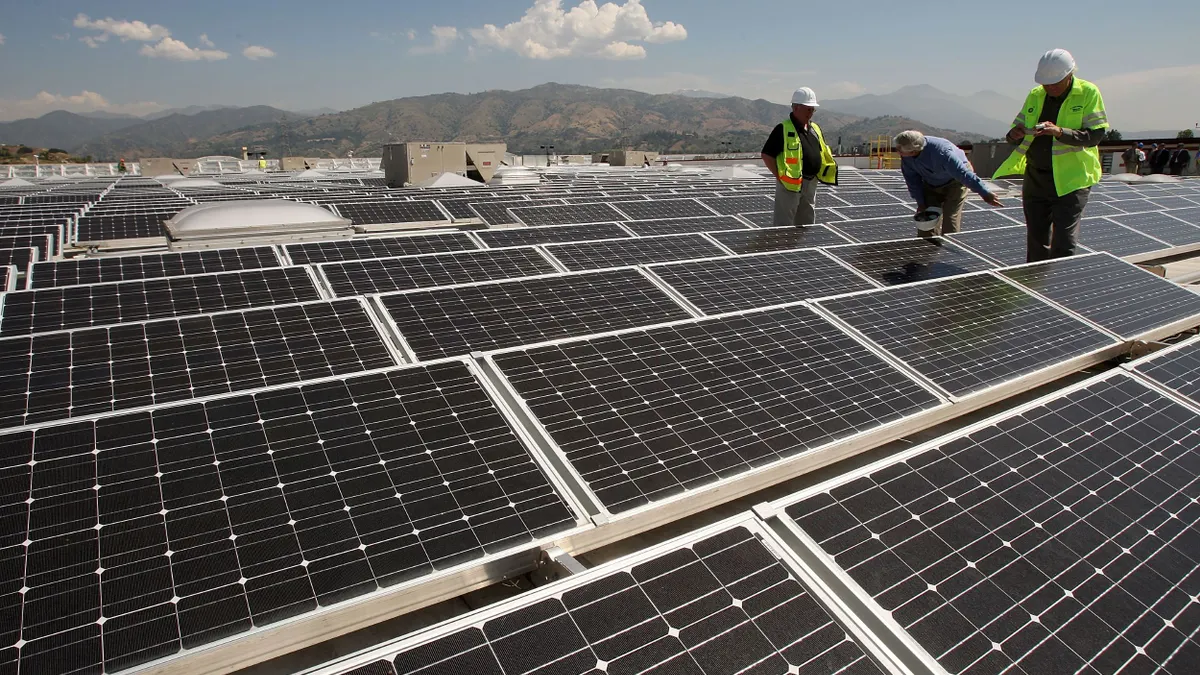
The utility-scale solar sector is maturing right before our eyes. The resource's prices are falling so fast, it's on the verge of edging out natural gas on cost, according to the industry's latest progress report from the Department of Energy’s Lawrence Berkeley National Laboratory (LBNL).
“Utilities should take another look at utility-scale solar because they may be surprised at how much prices have come down. Prices from just two years ago are now grossly out of date,” noted Research Scientist Mark Bolinger, co-author of LBNL’s recent report, “Utility-Scale Solar 2014; An Empirical Analysis of Project Cost, Performance, and Pricing Trends.”
Solar may now be a better choice to protect utility ratepayers from price hikes than natural gas, he added, because the prices in solar contracts are generally fixed, while fossil fuel plants are at the mercy of market prices for their fuels.
Growth up, prices down
One set of numbers tells the story of how quickly utility-scale solar is emerging:
The first projects fitting LBNL’s definition of a utility-scale photovoltaic solar facility — any ground-mounted array of 5 MW or greater — were installed in 2007, and there were 194 such projects online at the end of 2014. Of the 6,236 MW the projects comprised, more than half of that capacity — 3,218 MW — went online in 2014 alone.
That breakneck pace of growth shows little sign of slowing in the short term. Installation increased by 729 MW in Q2 2015 alone, according to the "Q2 2015 U.S. Solar Market Insight Report" from the Solar Energy Industries Association (SEIA) and GTM Research. It was the ninth consecutive quarter that the utility-scale market segment grew by at least 500 MW, and the sector is widely expected to continue its growth pattern until the potential sunset of the 30% federal investment tax credit for solar at the end of 2016.
But while those growth numbers are impressive, utility-scale PV's cost figures are more eye-popping.
The median price in power purchase agreements (PPAs) fell to $3.10/watt (AC) in 2014, a 50% fall from the average price from 2007 to 2009, and a 37% drop from the price in 2010. The lowest prices were at $2.00/watt.
The least expensive 20% of the prices sampled went from $3.20/watt in 2013 to $2.30/watt in 2014.
Utilities have taken advantage of the new, lower prices.
NV Energy recently reported signing a PPA for the 100 MW output of First Solar’s Playa Solar 2 installation at $0.0387/kWh after paying at $0.046/kWh for the output of SunPower’s 100 MW Boulder Solar installation last year. The utility bought utility-scale solar power for an average of $0.1377 per kWh for solar generation over the course of 2014.
Austin Energy recently received record low bids below $0.04/kWh in response to its 2015 request for proposals (RFP). Those bids were 20% lower than the contract it signed with Recurrent Energy in 2014 for $0.045/kWh and only 25% of the $0.16/kWh it paid for the 30 MW Webberville project, the utility's first large installation.
Deep Market
The price declines represent more than just a few exceptional PPAs, Bolinger said.
“The responses to utility solicitations show quite a bit of capacity priced very similarly to the winning bids in the RFPs, and that confirms this pricing is real," he said.
LBNL’s survey of developer responses to solicitations found concrete evidence of a deep market.
The Austin Energy RFP for 600 MW of solar received 149 unique proposals representing 7,976 MW from 33 different bidders. “Almost 1,300 MW were reportedly bid at levelized prices of $45/MWh or less,” LBNL reports.
A Southwestern Public Service 2014 RFP for 200 MW of utility-scale PV received 112 project bids representing 5,250 MW. Some 2,958 MW were bid at levelized prices ranging from $40/MWh to $50/MWh, and 1,782 were bid at levelized prices ranging from $50/MWh to $60/MWh.
Of the 2,537 MW of renewable resources bid into the 2015 NV Energy RFP, more than 90% were solar. LBNL did not get pricing information for the non-winning bids, but several hundred MW of shortlisted capacity were reportedly bid at prices very similar to the winning bids. In addition, the solar bids were priced lower than wind or geothermal bids, according to the utility.
The LBNL study found such responses suggestive of "a significant amount of utility-scale PV capacity capable (at least with the 30% ITC) of selling electricity at very low prices in the Southwest,” the LBNL study reports.
Financial cash flow models using real world parameters produce hypothetical PPA prices that match current market prices, Bolinger said. “There isn’t much question the current solar technologies are viable and these projects should be profitable, even at the new low PPA prices.”
New highs in capacity factors
Technology advances are also allowing utility-scale PV installations to generate more power for every MW of nameplate capacity. That means higher project capacity factors. And higher capacity factors enable low PPA prices, Bolinger explained.
“The highest capacity factors in our sample are up around 35%, which is comparable in the Southwest to wind power,” he said. “That may surprise some people because the sun only shines during the day whereas wind could come around the clock.”
The four key drivers of a project’s capacity factor are the strength of the solar resource, whether the panels are fixed or track the sun, the inverter loading ratio, and the module type, Bolinger said.
“Module type does not have much impact," he said, "but the other three variables have a strong influence.”
Capacity enhancement factors may increase the cost per MW of the project, but they can reduce the cost per MWh of production even more, Bolinger said.
Unsurprisingly, projects sited in stronger solar resource areas have substantially higher capacity factors, all else being equal, the study reports. There is an average 8% advantage to being in the highest resource area versus being in the lowest resource area, though that difference may be affected by a project’s tracking technology and inverter loading ratio.
Single-axis tracking ups the average capacity factor by 3% to 4% over projects that used fixed-tilt racking.
An increase in the inverter loading ratio, which means adding more panels to the array but keeping the same size inverter, alters the array’s average capacity factor between 1% and 6%, depending on the solar resource.
The differences in project-level capacity factors by module type are generally smaller than for the other variables and exhibit few patterns beyond that there seems to be a strong preference by developers of thin-film projects for fixed-tilt racking, the study reports.
“Tracking has become a lot more reliable and the cost has dropped so the developers will get extra MWh by shifting to it,” Bolinger explained. The new numbers may simply reflect the recent purchase by First Solar, one of the world’s biggest usPV developers, of tracking technology provider RayTracker.
One of the big drivers for choosing First Solar’s cadmium telluride thin film modules for Southwestern desert projects is their thermal coefficent, Bolinger said. “When you have that strong a resource, it makes sense to track it.”
Low prices have the South rising
In addition to the capacity factor drivers, Bolinger said, the planned sunset of federal tax incentives at the end of next year is spurring short-term growth.
"We are heading into 2016 and developers are bidding aggressively to get contracts in place so they can build their projects ahead of the reversion of the ITC," he said.
The federal investment tax credit (ITC) was raised to 30% in 2006 to support solar growth, after having long been at 10%. Congress is expected to allow it to revert to 10% when the increase now in place expires at the end of 2016.
The ITC may have been successful enough as an incentive for the utility-scale sector to sustain strong growth beyond the reversion, Bolinger said.
Modeling with aggressive parameters and a 30% ITC produced a levelized PPA price of about $43 per MWh. The same modeling with a 10% ITC only increased it to about $54 per MWh, he said.
“There have been a lot of contracts signed at that level and it is not clear to me demand will suddenly dry up if we go back to a 10% ITC in 2017,” Bolinger said.
He also anticipates further installed cost reductions.
“The CEO of First Solar recently essentially promised their installed prices would be below $1/watt in 2017,” Bolinger said.
The result of the lower prices is an expansion of utility-scale PV to regions beyond the Southwest, particularly in Southeast, Bolinger said.
“We are seeing contracts in the $50/MWh to $60/MWh range in states like Arkansas and Alabama that haven’t seen solar development," he said.
Of LBNL’s 8.7 GW of sample projects, 96% were in the Southwestern states of California (68%), Nevada (11%), Arizona (11%), Texas (4%), and New Mexico (3%).
Even so, “there have been a number of notable announcements over the past year about new utility-scale solar PPAs being signed at competitive prices in several southeastern states,” the study reports. They include:
- Georgia Power long-term PPAs signed in Oct. 2014 for 545 MW at an estimated average PPA price of $65/MWh or less
- A Feb. 2015 Tennessee Valley Authority PPA for 80 MW at a price of $61/MWh
- An April 2015 Entergy Arkansas PPA for 81 MW at a price just above $50/MWh
- An Amazon Web Services PPA for 80 MW at an undisclosed price
- A July 2015 Orlando Utilities Commission PPA for 13 MW at $70/MWh, less than half the $194/MWh price of its 2011 project
The trend is especially noteworthy “because the Southeast has historically not seen much renewable energy development,” the study explains.
“If people in the Southeast see they will not be on the losing end of the Clean Power Plan and other policies proposed to combat global warming, there might be less resistance there,” Bolinger added.
See Also: How a new petition is dividing rooftop and utility-scale installers in SEIA
Solar's competitive advantages
At the new low PPA price levels, “solar can compete head on with wind power in terms of both price and generation profile,” the LBNL study also finds.
Both renewable resources, because their PPAs lock in cost over long contractual periods, offer a hedge value against the volatility of fossil fuel prices, Bolinger said.
Competition for PPAs is emerging between wind and solar in the Southwest and Texas, he said.
“It would be difficult to build wind in the $50 per MWh to $60 per MWh range in many places in the Southeast. And the solar resource is more widespread," Bolinger said.
Solar has several advantages over wind. It is available more often during the day, closer to peak demand periods, and has less risk in the form of moving parts and annual resource variation.
“All in all, it is a more predictable resource,” Bolinger said. “If they can get a solar PPA at a similar price as a wind PPA, nine times out of ten they will choose solar.”
More significantly, PPA prices for utility-scale PV are starting to match the fuel costs of natural gas power generation, Bolinger said. “Even if the utility doesn’t need new generation capacity for the next five or ten years, solar could allow a utility to back off the gas plant and save on fuel costs.”
And, Bolinger added, if solar can compete with the fuel cost of natural gas generation now, without considering any fixed capital cost recovery for the gas plant, it is likely to be an even better investment going forward because “it is a good bet gas prices aren’t going much lower.”
“Most solar PPAs have no escalator," Bolinger said. "That means the price declines over time in real dollar terms. Natural gas price projections tend to increase over time in real dollar terms."
The LBNL report is a high-level cost measurement and doesn't break down cost factors for specific utilities to compare costs. Even so, the nationwide drop in utility-scale PV prices, especially combined with the freedom from fuel costs, is still “a good reason for utilities to take another look at solar,” Bolinger said.
"Solar is a little more expensive than natural gas at current prices but looking out a few years solar gets cheaper pretty quickly,” he said.


