Dive Brief:
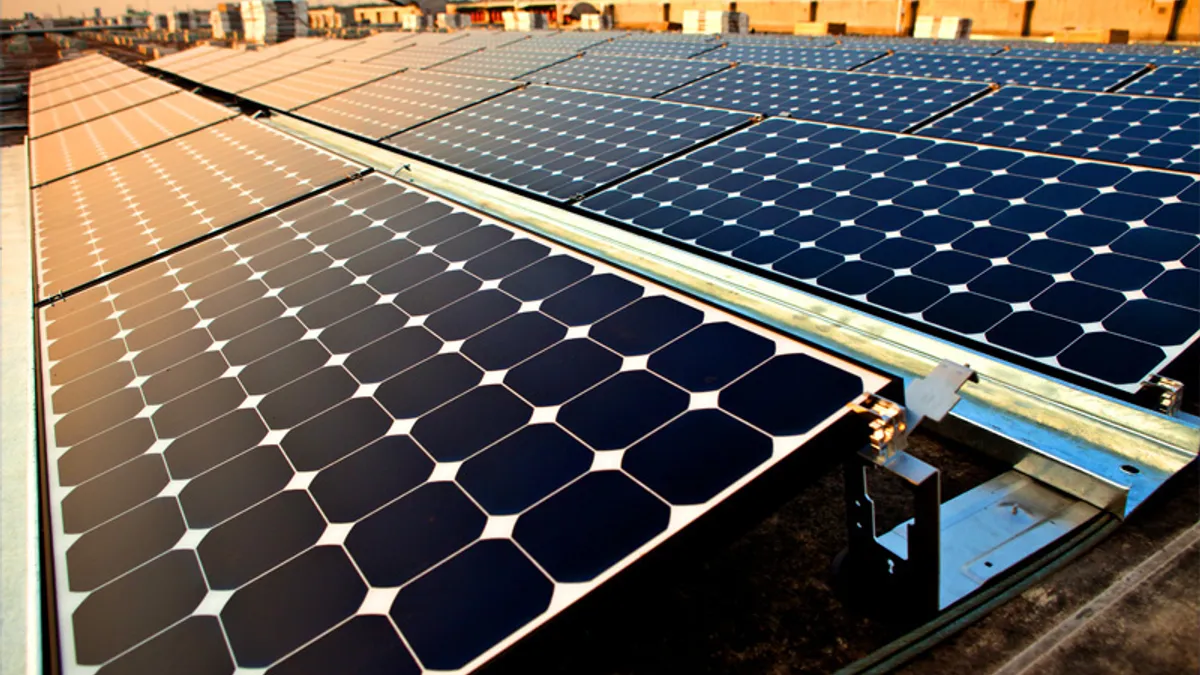
- U.S. residential solar photovoltaic (PV) installed capacity grew by 437 MW in Q1 2015, a 76% increase over Q1 2014, according to the "Q1 U.S. Solar Market Insight report" from GTM Research and the Solar Energy Industries Association. The average residential installed cost was $3.48 per watt, 10% below Q1 2014’s installed cost.
- Total solar PV installed capacity, including the commercial-industrial and utility-scale sectors, grew 1.3 GW during the same time period — typically the year's slowest quarter — laying the groundwork to reach a forecast 7.9 GW of new installed PV capacity in 2015, a 27% year-on-year jump.
- In the sixth consecutive quarter in which U.S. solar PV increased by over 1 GW, both the residential and utility segments added more capacity than the natural gas industry. Over half of the generating capacity added in the first quarter was solar, according to SEIA.
Dive Insight:
More than one-third of all community shared solar has come on-line since 2014. There are currently over 58 community shared solar arrays in 22 states and it is the “biggest trend” for solar at utilities, according to Senior Research Manager Becky Campbell, co-author of a recent Solar Electric Power Association (SEPA) report on the topic.
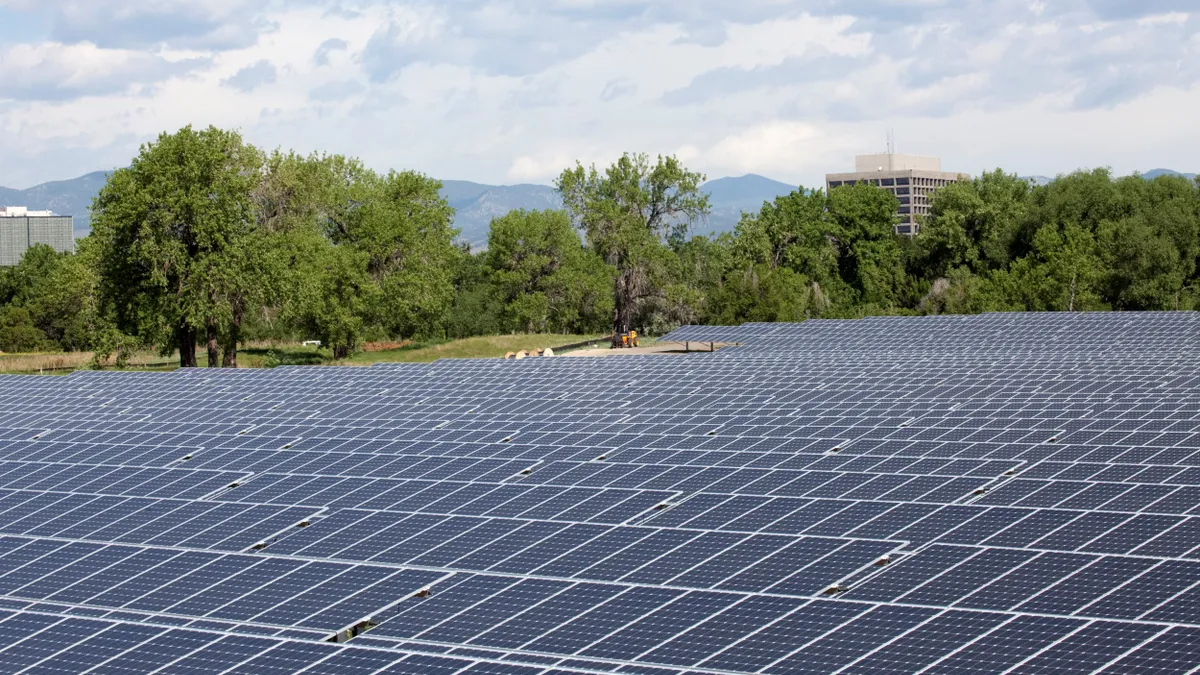
Over 5 GW of central generation PV has been procured by utilities, demonstrating solar’s price competitiveness with fossil fuel central generation and the effectiveness of state renewables mandates.
Growth has been biggest in the residential sector. There are now about 700,000 individual U.S. solar systems, including the 66,440 interconnected in Q1 2015. The forecast is that over 3 million residential systems will be installed through 2020 as part of a broad trend toward customer choice in energy.
Concentrating solar power’s 767 MW in 2014 was its biggest year. The next important CSP project, expected online before the end of 2015, is SolarReserve’s 110 MW Crescent Dunes solar power tower with molten salts storage.


