Dive Brief:
- U.S. solar power generation has gone up by 418% in the last four years, from a 0.22% share of total U.S. generation to a 1.13% share. U.S. solar capacity has gone from 2,236 MW in 2010 to 12,057 MW as of February 2014, according to the U.S. Energy Information Administration (EIA).
- California is leading all states in solar generation (both rooftop and utility-scale). The state’s net metered solar capacity makes up 38% of the U.S. total, and 49% of the total utility-scale solar generation.
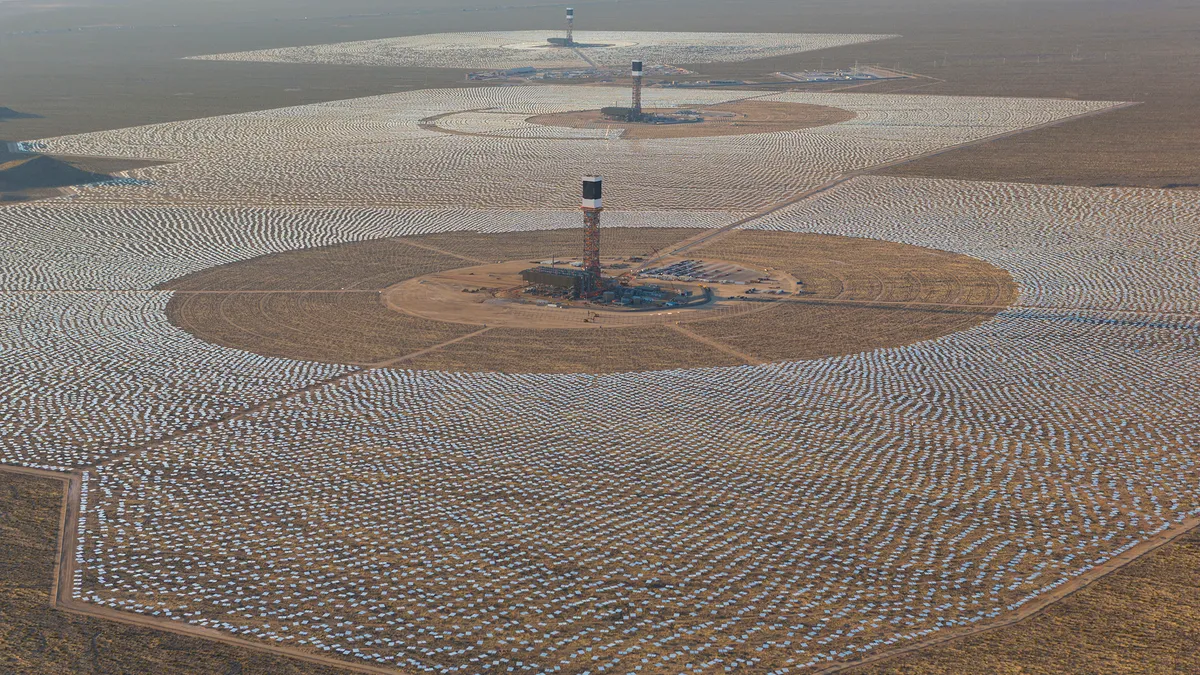
- California is also leading the way solar thermal energy. Currently, the state produces all solar thermal energy in the U.S., accounting for 1,050 MW of total generation.

Dive Insight:
Solar appears to be following a similar pattern as wind power. From 2005 to the start of this year, wind generation increased nearly tenfold, from 6,456 MW to 60,661 MW.
Clear skies and good weather all year round aren’t the key growth factors for solar: New Jersey and Massachusetts, not known for their year-long sunshine, produce 21% of the total U.S. net-metered solar generation.
The same can be said for solar’s growing foothold in the large-scale utility sector: North Carolina utilities generate 6% of utility-scale solar generation, mostly due to state incentives making solar more lucrative in the long run.
All indicators say solar is here to stay, and it is growing: there are 6,459 MW of proposed utility solar projects and 1,841 MW of proposed thermal solar projects awaiting approval.
Rooftop solar is on the rise: The cost of a solar panel has dropped significantly in the last decade, and with many consumers feeling disgruntled after last winter’s high energy bills, the opportunity to see utility bill savings is becoming increasingly appealing.


