Dive Brief:
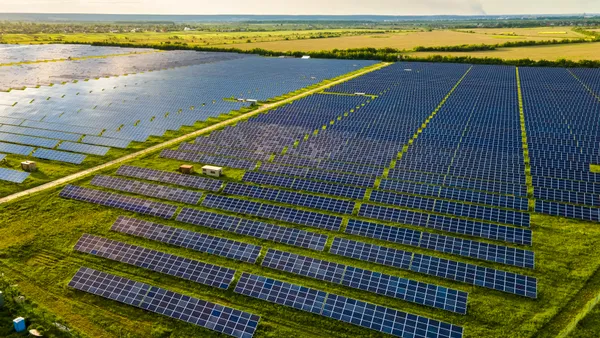
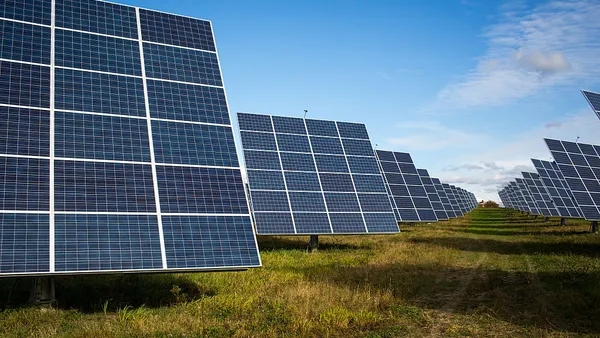
- In 2022, around 10% of all new residential solar installations included paired storage — up from virtually zero in 2015, according to Lawrence Berkeley National Laboratory’s annual Tracking the Sun report. The median size of residential systems reached 7.2 kW last year after rising steadily for years.
- “For residential, the trend [of solar plus storage] has been increasing linearly, almost, since around 2016,” said LBNL staff scientist and lead author Galen Barbose during a Wednesday webinar discussing the report.
- Storage is also being increasingly added to existing solar installations. In 2022, 23% of new paired systems had the storage retrofitted on, LBNL said.
Dive Insight:
Across the U.S. market, California “dominates” in sheer numbers of residential solar installations, according to LBNL. And 11% of those systems have attached storage, a trend Barbose said is driven in part by rebates for storage and by the California Public Utilities Commission’s Self-Generation Incentive Program.
However, system sizes in California only average 7.1 kW – “near the low end of the spectrum,” LBNL said, which pulls the U.S. median downward. While median system sizes in most states are “well above 8 kW, and in many states above 9 kW,” California’s overall share of the market means national median size is 7.2kW.
Texas continues to be a market with “particularly high levels of activity” when it comes to residential solar installations, which Barbose attributed in part to Winter Storm Uri.
“Following that event, we see quite a bit of increased uptake in solar plus storage,” he said.
CenterPoint Energy, which serves the Houston area, saw interconnection applications for solar plus storage systems triple last year, while Oncor — which serves the Dallas-Fort Worth area — saw six times as many applications in 2022 as it did the year before, Barbose said.
LBNL has found that median installed prices for standalone solar installations have fallen “by roughly $0.4/W per year, on average,” but price declines “tapered off” beginning in 2013 and began to average $0.1-0.2/W per year since then.
“That tapering off is mostly a function of the underlying trajectory of module costs, which fell precipitously from 2008-2013 before leveling into a more gradual rate of decline,” the report said. “The current installed price trajectory is now primarily driven by changes in balance-of-system and soft costs, which comprise the vast majority of overall system prices.”
Installed pricing data also exhibits “substantial variability” across projects, the report said, as the result of “underlying differences in project-level characteristics, installer attributes, and features of the local market, policy, and regulatory environment.”
Installer attributes include equipment preferences and relationships, business models, and loan partners, Barbose said.
“As someone out in the market buying equipment, material, and services, the Tracking the Sun report tells me two main things about the state of solar,” Carl Newton, DSD Renewables vice president of strategic procurement and estimating, said in an email. “The market is stable and solar continues to have a lot of value in it to deliver low cost power and installer experience is a big variable.”
“The report also reinforces the fact that there is a lot of room for growth in the [commercial and industrial] sector for battery pairing,” he said.


