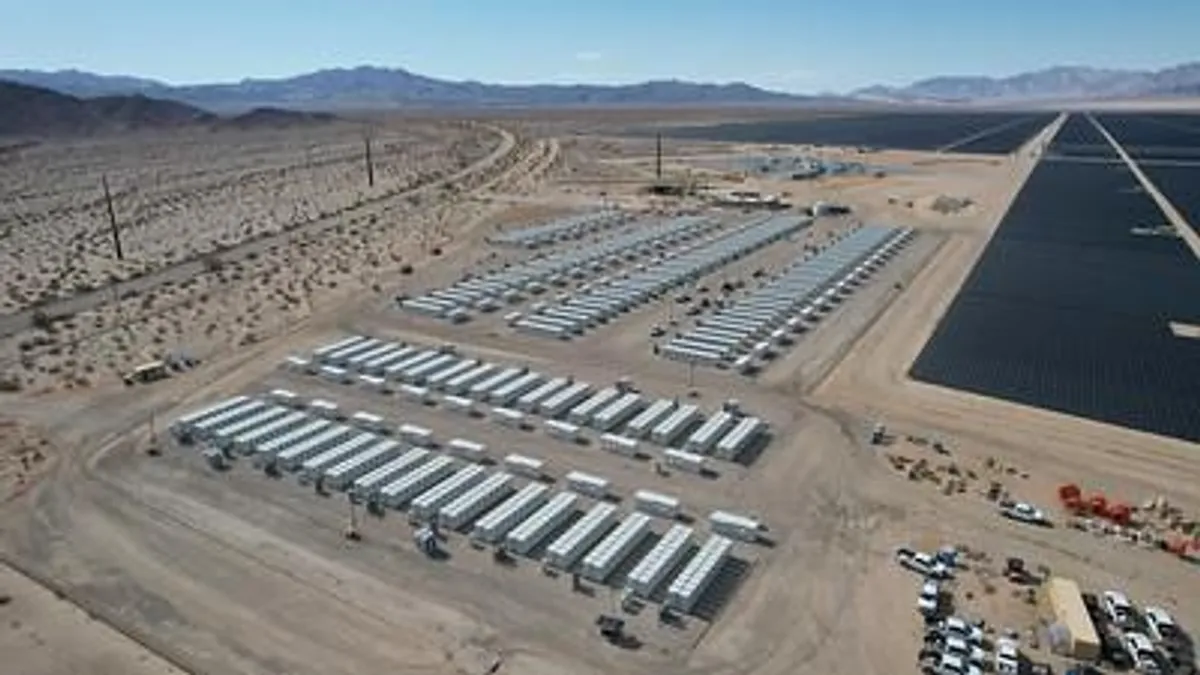
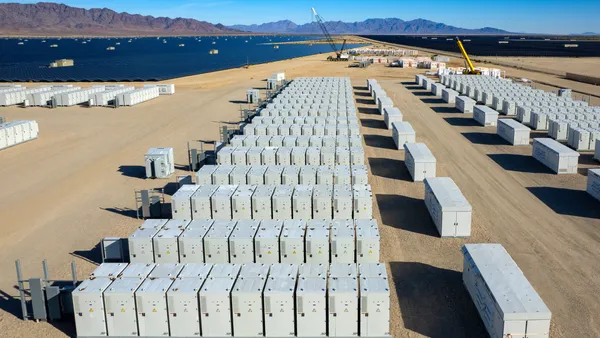
The overwhelming majority of solar projects in Western interconnection queues are hybrid facilities co-located with energy storage, reflecting higher penetration levels and declining contributions to meeting peak demand, according to data from S&P Global Market Intelligence.
Over 98% of the solar capacity proposed in the California Independent System Operator footprint is hybrid, Adam Wilson, senior energy research analyst at S&P Global Market Intelligence, said in a Thursday webinar. In the non-ISO portions of the West, the figure is around 87%. In most instances the solar projects are paired with storage, though there is also some co-located wind, he said.
Currently, roughly a quarter of installed solar capacity in those markets is co-located with storage, according to S&P data.
“Developers are starting to see the writing on the wall,” Wilson said. “They see the rising curtailment, increasingly distorted duck curves, they see the plummeting peak demand contribution levels for incoming solar projects and realize that if more solar is going to be brought online, having it co-located with battery storage is almost a requirement.”
In the Electric Reliability Council of Texas region, hybrid solar projects are approaching 50% of the total proposed solar capacity.
Interconnection queues in the PJM and Midcontinent ISO footprints “suggest [a] pending solar boom with both regions having over 100 GW of proposed solar capacity,” according to a presentation Wilson gave. Hybrid systems have “yet to gain firm foothold,” though recent data “suggest that tide may be turning.”
Solar capacity around the U.S. has been rapidly expanding “regardless of state-level policy,” Wilson said, aided by the long-term extension of tax credits in the Inflation Reduction Act and materials “being somewhat insulated from inflationary pressures over the last few years due to things like panel oversupply ... which has helped keep the upfront cost of grid-scale solar down, particularly compared to new wind projects.”
There are currently just under 21 GW of operating solar capacity in CAISO, according to S&P data, while ERCOT and the non-ISO Southeast are not far behind with over 20 GW each. There is also over 16 GW of operating solar capacity in the non-ISO West, driven largely by Arizona and Nevada. ISO New England and New York ISO, which are smaller markets, have about 3 GW and 1.8 GW, respectively.
While California remains the nation’s solar leader, Wilson said it is likely that ERCOT will take over the top spot sometime this year.
“If you just look at growth rates of installed solar since 2020, ERCOT leads all regions with a compound annual growth rate of about 44% over the last four years. CAISO is actually last in annual growth rate, just under 10%,” he said.


