Utilities and grid operators are turning to experts to handle the big data they are gathering.
Use of data about their systems and their customers varies widely. While it can inform transactive energy services that will ultimately mimic an electricity market at the customer level, more often today it is about simply reporting peak load event information to customers via email.
There are three areas where utilities are working to build big data operations, according to ABB Smart Grids VP Gary Rackliffe.
ABB’s acquisition of Ventyx and its business intelligence software, which is used by over 50 utilities, solidified its standing among other smart technology leaders like GE, Siemens, and Alstom.
Currently, Rackliffe said, ABB is working to:
- improve distribution grid management, particularly around storm restoration,
- improve system health management by precisely assessing risks of asset failure, and
- manage distributed energy resources integration into transmission and distribution systems.
“There are five Vs in big data,” Rackliffe said. “Volume, how much data. Variety, the types of data. Velocity, the rate the data comes in. Veracity, the accuracy of the data. And value, the usefulness of the data.”
Storm response and asset health
In the first application, ABB is assimilating storm data. “We data mine information on past storms to predict how the system will be impacted and to estimate restoration times,” Rackliffe said. Based on that situational awareness, ABB can “predict the type of equipment inventory and crew resources that will be needed to handle grid restoration.”
In the second application, American Electric Power (AEP) is now rolling out the ABB-Ventyx Asset Health Center. With over half its transformers more than 50 years old, AEP is integrating its system data with ABB’s operations technology/information technology (OT/IT) capabilities, Ventyx's business intelligence and layered-in analytic algorithms to manage its 40,000-mile, 11-state, 5-million-customer grid.
“Our customers want to drive down the total risk of failure and get better performance with the same number of people or get the same performance with fewer people,” Rackliffe said. “And there is a big wave of concern now about being able to manage aging infrastructure.”
Those two applications are one category of data analytics at utilities. Consumer analytics is the second and it includes demand response (DR).
Transactive energy and demand response
Meter data and other data on customer behavior is used “to tease out consumer preferences and understand how different DR programs like peak-pricing or time-of-use rates or [electric vehicle] charging will affect demand,” Rackliffe explained.
ABB is working with European utility giant Vattenfall in Gotland, Germany, on a project targeting a 10% load shift at 2,000 homes and 30 commercial facilities. It will use Ventyx’s Demand Response Management System (DRMS) to manage a consumer marketplace with the full range of transactive energy services, including wind, solar PV, energy storage, EV charging, and tiered pricing, Rackliffe said. “Predicting customer responses is where data analytics is going.”
Like the Opower-BGE pilot in Baltimore, Austin Energy and City of Palo Alto Utilities (CPAU) have also been using data analysis, though on a smaller scale, to study consumers’ reactions to DR.
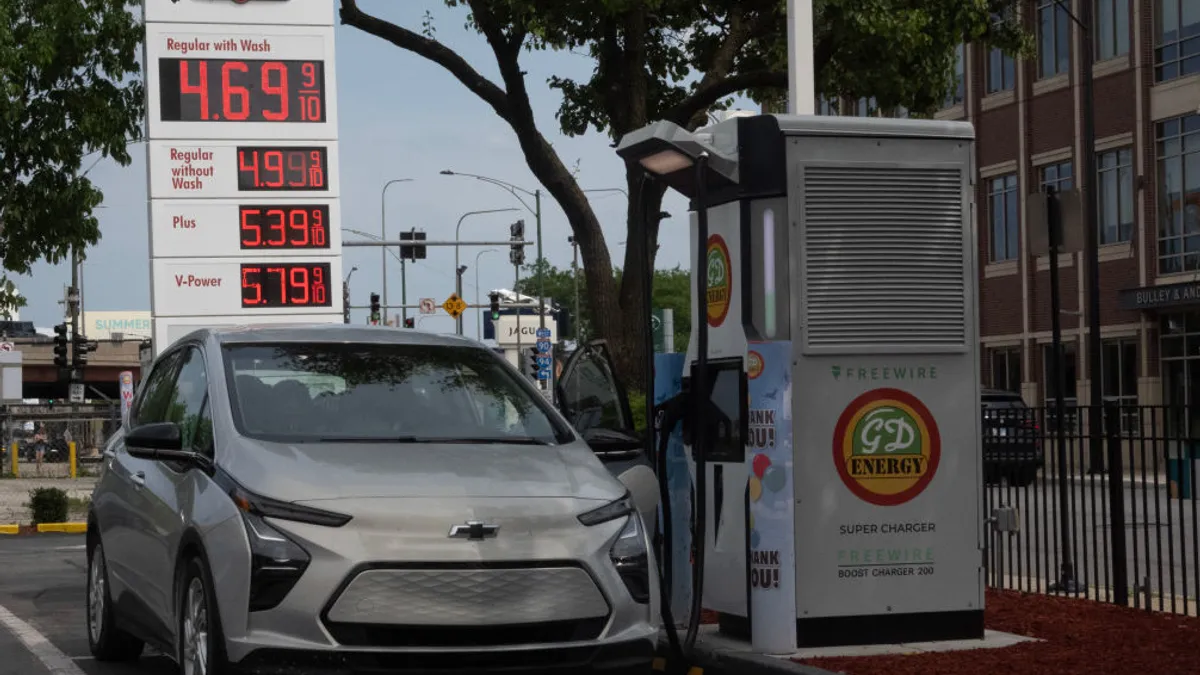
An Austin Energy demonstration program, funded by a Department of Energy ARPA-E grant, tested how AutoGrid’s Demand Response Optimization and Management System (DROMS) could be used to reduce peak load. The utility used the single platform to control 60 thermostats from two different manufacturers’ and 15 electric vehicle chargers from a third manufacturer, all at dispersed customer locations, explained Austin Energy Consulting Engineer Russell Shaver.
Over about a dozen peak demand periods in June and September of 2013, the AutoGrid software was able to adjust the thermostats’ temperatures up four degrees and turn off the car chargers for about two hours. The platform also allowed EV owners to turn their chargers back on via email and allowed customers to push a button on the thermostat if they chose to opt out of the event.
Austin Energy had no experience with other data analytics vendors but was impressed with what AutoGrid could do. “When we have a DR event, we have to go into each different online portal provided by each of our thermostat manufacturers to issue a DR signal,” Shaver said. “We want a centralized DR portal like the one built by AutoGrid so we only have to issue that signal once.”
The City of Palo Alto Utilities (CPAU) has been running “a very small [demand response] pilot” with seven or eight large commercial customers for four years, said Senior Resource Planner Karla Dailey. “During a May 14 event, the only one this year, we were able to reduce the load 5,653 kilowatts.”
CPAU used AutoGrid to communicate the event to its customers, to do the back end analytics and to report savings to its customers, Dailey said. It has not tested AutoGrid’s claims to be able to manage petabytes of data.
Dailey sets up the parameters of the anticipated event and participants are emailed. “AutoGrid is a communication tool for us,” Dailey said. “We don’t make demand reduction happen. The capability is there but we are not there.”
Demand response has a lot of potential but it is utility specific and depends on the customer profile, the local climate, and on costs. “There is no one-size-fits-all for DR programs,” Dailey said. “All we are trying to do is shave our summer peak. But there are lots of other things a utility can do with DR and we are going to be looking at all of them.”


