The solar industry is quickly maturing and moving with unprecedented speed into the mainstream energy world. But while business is getting better, it’s not getting any easier.
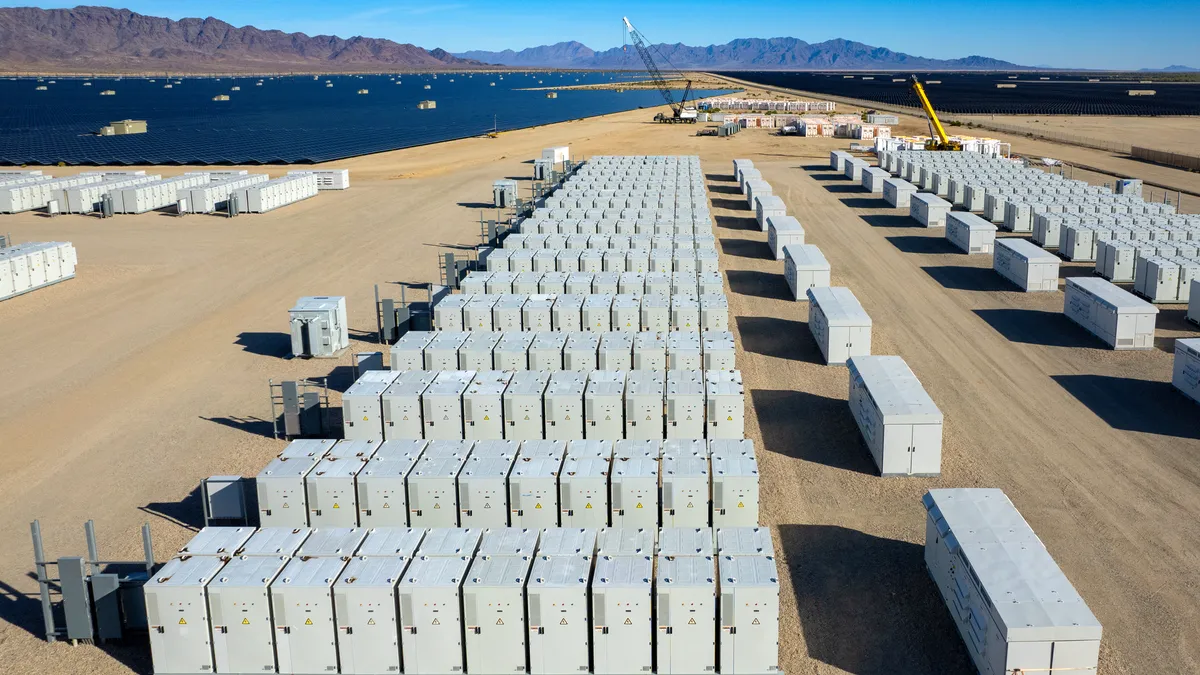
Solar composed 26% of new electric generating capacity in the U.S. during the first half of the year, with utility-scale making up 56%. Overall growth in the solar sector was 43% bigger in this year’s second quarter compared to the same time last year, according to the just-released Solar Market Insight Report from the Solar Energy Industries Association (SEIA) and GTM Research.
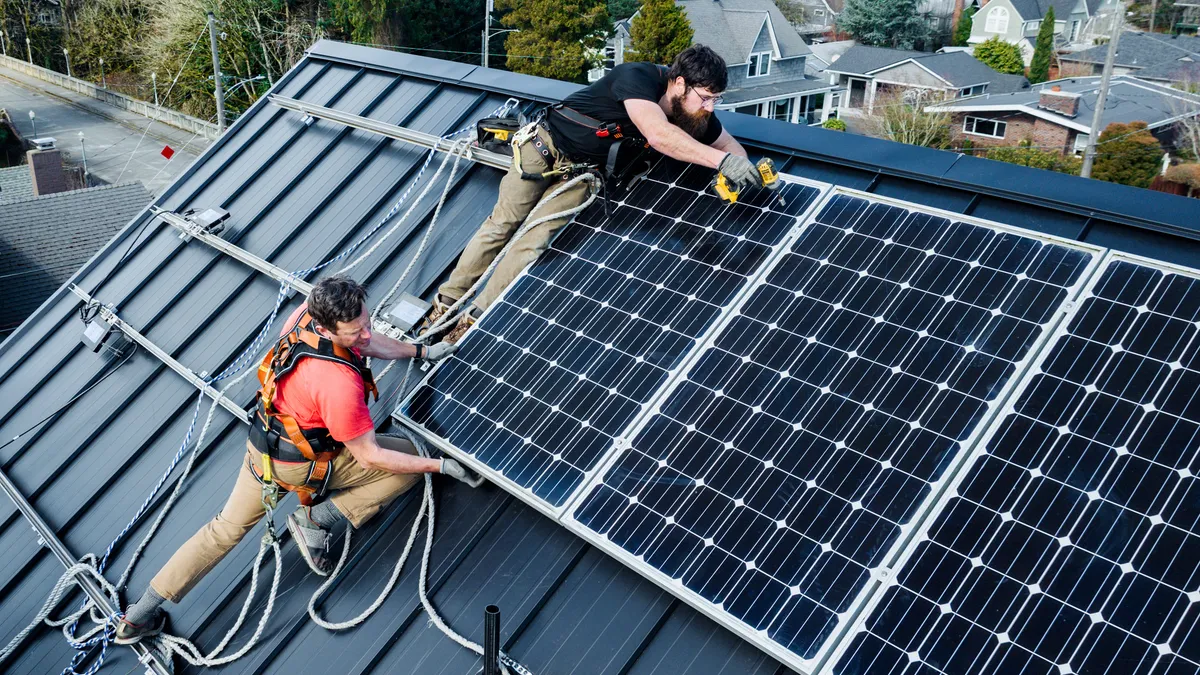
But the residential solar market appears to be showing signs of slowing down, as Q2 growth was largely driven by the utility-scale solar adding more than 1 GW of new capacity, according to Cory Honeyman, senior solar analyst for GTM Research and the report’s lead author.
“For the last four years, the national residential solar market has grown well over 50% annually and it grew over 70% year over year in 2015 but it is now expected to grow this year by only approximately 23%,” Honeyman told Utility Dive.
Solar got a much-needed boost when Congress extended the 30% investment tax credit (ITC) at the end of last year, but state-level policy changes are also playing a part, Honeyman said.
Two policy factors in particular are driving the market slowdown: solar incentives and the extension of the ITC. A report from the Consumer Energy Alliance (CEA) said high penetration from distributed generation has sparked questions over the right incentives for this type of growth.
“Distributed solar has increased 40% or more year over year and state incentive programs’ initial goals have been or are being met,” Michael Whatley, executive vice president of CEA, said. “Questions are now arising about whether the incentives are right for this level of penetration.”
But reducing solar incentives could be damaging to thriving solar markets, as seen by examples like Hawaii and Nevada.
Dan Whitten, SEIA’s communications vice president, said the CEA report lacks a full understanding of the benefits solar offers consumers. Regulators, he said, need a full understanding of those benefits and how they outweigh the costs of incentives.
The impacts of solar policy on residential solar
California has long had a dominant share of residential installations, Honeyman said, which means “weakness there can disproportionately impact the national numbers.”
Number projections for 2016 seem to suggest California’s residential solar market share will fall to 42% of residential installations, its lowest ever annual projection, Honeyman said. Already the slowdown is appearing in overall growth, which,at 650 MW for Q2, was only slightly up from the previous quarter.
California policy changes were fundamental to the slowed growth, Honeyman said, setting the stage for potential implications as similar policy changes are under debate in many other states. For instance, California’s eventual transition to time-of-use rates as part of its NEM 2.0 proceeding is one major policy change.
Explaining how rates can vary by times of the day and how they will affect the return on new systems complicate the rooftop solar sales discussion with homeowners, Honeyman said.
And such explanations make it difficult to set the right price for loans and leases, he added. “The more there has to be policy in the sales pitch to the homeowner, the more complicated it becomes."
Eventually, NEM 2.0 is expected to bring changes to the retail rate remuneration credit. As the availability of the original net metering arrangement in the San Diego Gas and Electric territory last year diminished, there was “a sharp uptick of installations,” Honeyman said.
“There has not been the same rush by customers to get in under the closing NEM 1.0 programs in the territories of Southern California Edison and Pacific Gas and Electric,” Honeyman said. The new, more complicated policy landscape could be slowing the response from customers of the state’s other two dominant electricity suppliers, he suggested.
Some installers see this more challenging sales cycle as due to “a change in customer demographics,” Honeyman said.
But policy-related complications could be harder to overcome if potential new customers are no longer the more easily convinced early adopters, Honeyman added. The addressable market in sunny California is still big but the “low hanging fruit” may have already been picked.
The other policy factor slowing the California residential solar market is “a hangover effect” from the ITC extension.
Faced with the possible elimination of the 30% tax credit for residential customers, many rushed to install solar last year. “That is no longer part of the sales pitch,” Honeyman said. Customers now see a three-year window and continuously falling costs. “The optics are that it makes sense to wait.”
The industry now must learn how to grow “in a more mature customer landscape and a more fragmented and complicated policy landscape," Honeyman said
The impacts of solar policy on utility-scale solar
The impact of the ITC extension on utility-scale solar became clear in the first quarter, and is getting bigger, Honeyman said. More projects are pushing their commercial operations dates (COD) from the second half of 2016 to 2017.
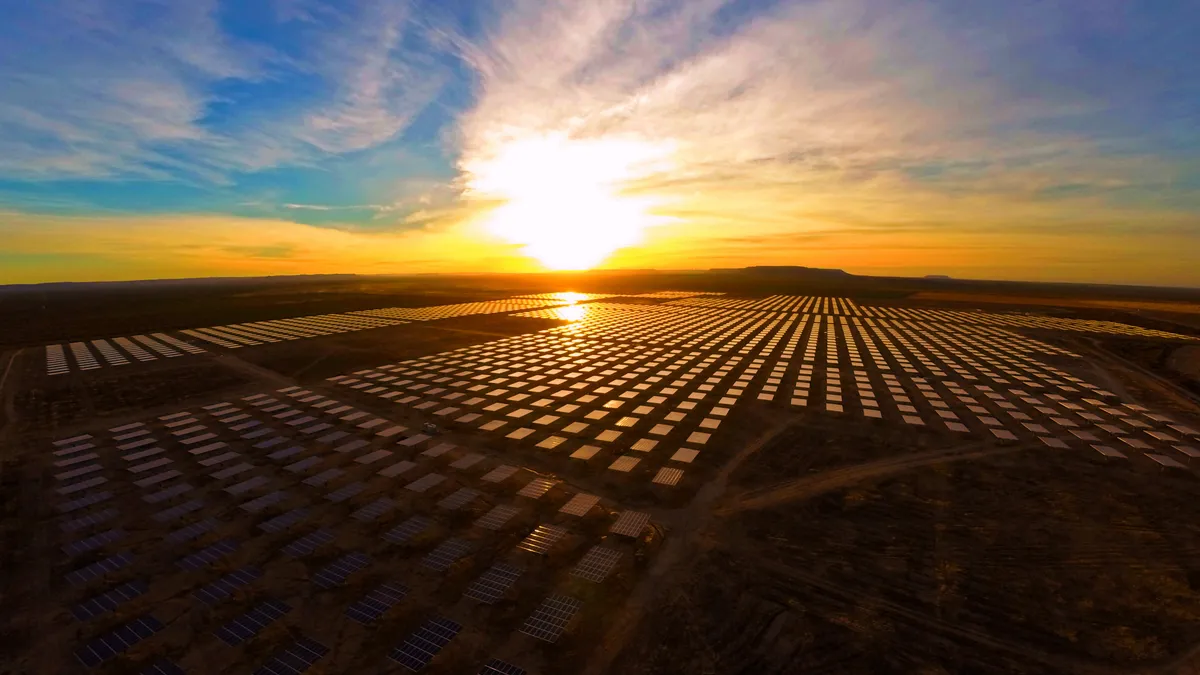
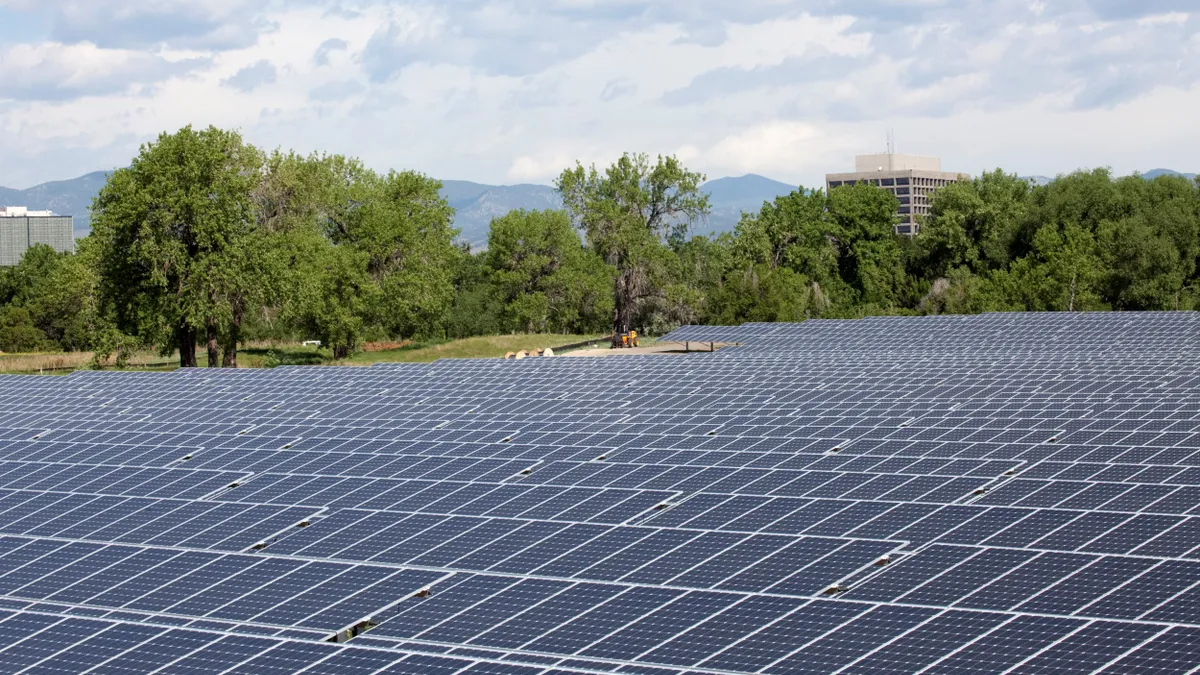
More than 1,000 MW of utility-scale solar was added in Q2 and a total of 9.9 GW of utility-scale solar is expected to be added for the year. But, as identified last quarter, last year's forecasts will be off because project deadlines have been pushed to 2017.
Utilities may accept project delays because they are ahead of their renewable portfolio standard (RPS) obligations. Or they may accept delays because they have had flatter load growth than they anticipated when they signed power purchase agreements (PPAs) and don't need the generation from projects now nearing completion.
Now that commercial solar developers no longer face the pressure of getting their project online to qualify for the ITC, they can request permission from utilities to return to original timeline if they have 2017 deadlines. The GTM Research team has tracked “close to 6 GW that have been in development, one-third of them in construction, that pushed their COD to 2017,” Honeyman said. That is an additional 1.5 GW to 2 GW of utility-scale solar since Q1.
Some financiers have reached a “saturation point” on usable tax equity for 2016 and want to push back deadlines for projects in which they have a stake to next year or the year after, Honeyman said. Developers who will delay have been offered improved terms that potentially outweigh any contract penalties. Developers may see another reason to delay the deadline, Honeyman said. “Some want to delay module procurement until next year to take advantage of lower prices from the current oversupply.”
The net result is that more than two-thirds of the 2017 forecast for 8.7 GW of utility-scale solar is spill-over from this year, according to Honeyman.
Stagnating demand for solar? Not from munis and co-ops
Driven by uncertainty over the ITC's possible phasedown last year, many investor-owned utilities (IOUs) over-extended their procurements in the past one-to-two years, continuing to impact the market.
“There was real pull-in of demand for utility-scale solar to beat the ITC deadline and the impacts will continue to affect procurement through 2017,” Honeyman said. “A lot of developers will face challenges for replenishing and building new pipelines next year.”
Utilities, in their solicitation process, are now calling for power delivery in 2018 and beyond, he added. To offset the challenges, developers are responding to the reduced project origination opportunities by approaching utilities and other off-takers that have not been active in utility-scale solar.
“They are also tapping into PURPA development and more unconventional or non-RPS-driven opportunities where there may be demand for 2017 and 2018,” Honeyman said.
Mimicking the wait-and-see approach of residential buyers, corporate demand is nascent at present. But demand is also rising from municipal utilities, cooperatives and community choice aggregators, with researchers expecting them to play an increasing role. Particularly, cooperative appetites for solar is on the rise for installations between 1-20 MW.
“These new off-takers are finding the price to be right now and trending downward,” he explained. “That means the number of projects with PPA prices below $50/MWh is likely to increase.”
Those cost-competitive PPAs are expected to grow in Southeast markets, the Pacific Northwest, and other regions “relatively new to procuring utility-scale solar beyond state mandates,” Honeyman added.
See Also: How a new petition is dividing rooftop and utility-scale installers in SEIA
How policymakers can tackle rising solar penetration
But how can policymakers address the challenges of rising solar penetration? CEA’s report has some suggestions, according to Whatley.
CEA assessed what it sees as the “most prominent and substantial types” of solar incentives, including incentives for residential solar customers and third party owners through tax credits, net metering policies and federal, state and utility monetary payments. Among them are the ITC and accelerated depreciation allowed to TPOs in exchange for funding now up-front payment leases and PPAs for residential customers.
There are also "state and/or local sales and/or property tax exemptions" and state renewable energy payments in the paper's assessment.
According to Whatley, utilities and policymakers can find five key takeaways from the paper when discussing incentives for solar.
First, in a random selection of 15 of the 50 states, the paper found state and federal incentives cover 59% or more of installation costs. And in seven states, such incentives can cover 100% of the cost in order to drive solar growth.
Second, incentives vary widely by states, the paper found, but it offers no discussion of whether variations in the other 35 states might diverge from the ones described in the paper.
In a third point, TPOs often don’t consider the value of the tax benefit when held up to the value of funding they provide homeowners so they can obtain solar without a high up-front cost burden, Whatley added.
And the money that goes to net energy metering “comes from somewhere else, usually other electricity consumers and it is a cost shift,” Whatley argued. The paper does not, he said, consider any benefits that might go to those "other electricity consumers" from supporting more solar on the system. It also does not calculate the amount of the perceived cost shift, he added.
To that end, the volatility of state and federal tax policies, rate cases, legislative debates and ballot initiatives could impact the availability of incentives. Incentives for utility-scale solar are less subject to policy volatility, he added. But SEIA’s Whitten said CEA’s report didn’t provide a full cost-benefit analysis of solar — similar to the one from studies from the Brookings Institute and from the states of Arizona, Maine, and California — that could benefit policymakers even more.
“Rooftop solar reduces costs of building additional polluting power plants and other expenses associated with adding dirty electric generating capacity,” he added.
The paper’s failure to include both the cost and benefit sides of the question makes it “a wolf in sheep’s clothing,” Whitten said. But the intention was not to do a cost-benefit analysis or methodologically rigorous study, Whatley told Utility Dive. One way to see the influence of CEA’s report will be to watch the Arizona value of solar proceeding, where the study was filed as part of the testimony this week.
One thing that both associations agree on, SEIA's Whitten said, is “the growing influence that solar will have in America’s rapidly evolving energy portfolio.”


