With the rise of distributed energy resources, distribution system planning is getting harder for utilities, but the cost of not doing it is also growing.
No more than a decade ago, planning was a matter of historical loads, load growth forecasts, and proposals to build new central station generation when it was needed.
That was then. Now, system planners face an emerging dynamic environment in which traditional generation is becoming less cost-competitive and integrating variable utility-scale renewables into the grid can be challenging.
Complicating matters, more uncertainty is coming over the next 10-year to 20-year planning horizon. Portfolios of renewables and distributed energy resources (DER) are expected to become the most cost-effective supply option within that timeframe. The DER will be owned by customers or controlled by private providers and challenging to forecast or plan around.
These rapidly shifting dynamics have introduced an unprecedented level of uncertainty into planning. Some utilities face "continuous refinement" in the forecasting methods they use for distributed resources adoption, according to new National Renewable Energy Laboratory (NREL)-led research.
It can be critical for a utility to get forecasting right if it has a big load or if it has, or expects, a high DER penetration. Underforecasting DER can lead the utility to make unneeded capital expenditures in utility-scale generation. Overforecasting can force the utility to fill generation shortfalls with energy purchases at power market prices.
Fortunately, sophisticated new forecasting tools are emerging to give utilities more insight into customer adoption practices.
The rise of distributed solar
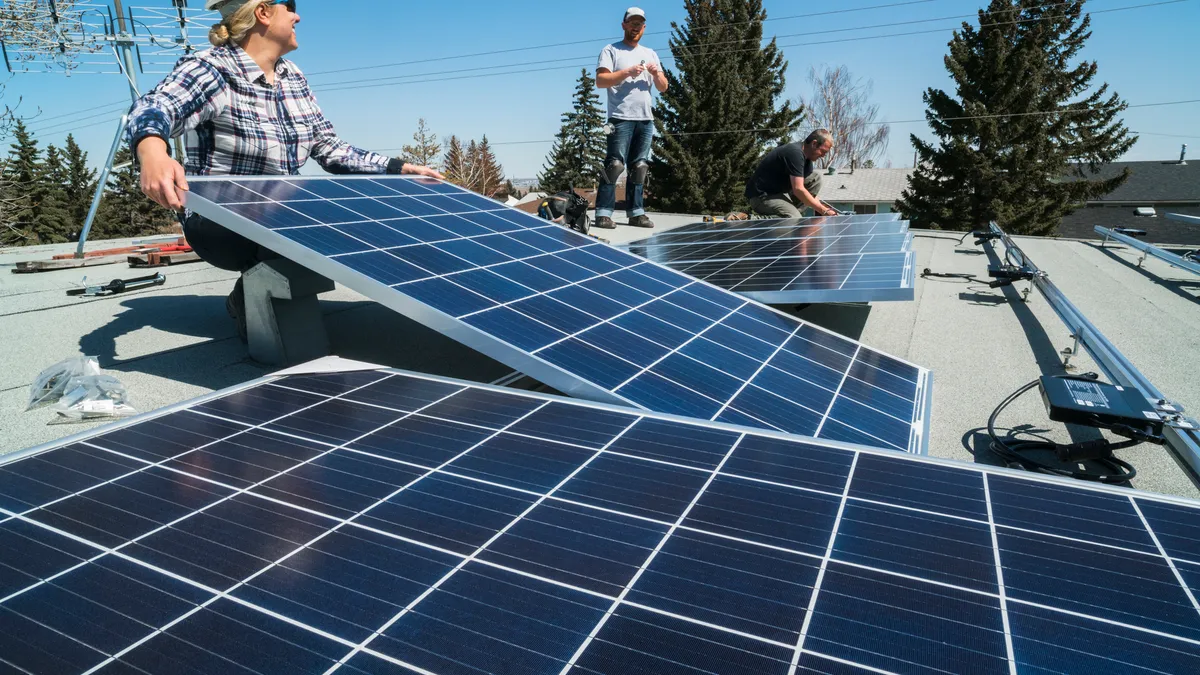
Distributed photovoltaic (DPV) solar generation was added to the U.S. Energy Information Administration's Electric Power Monthly data in December 2015 because it was growing so fast. At that time, DPV had grown annually since 2010 and extension of the federal investment tax credit into the early 2020s seemed to assure the trend would continue.
Over the last two years, DPV has also penetrated deeper into utilities’ customer bases, according to new research from Lawrence Berkeley National Laboratory (LBNL). Contrary to stereotypes, DPV adoption "has been trending towards more moderate-income households" and customers from the lower 60% of income levels are now "33% to 50%" of PV adopters, the researchers reported.
But the rate of residential solar growth, which had consistently been over 10%, contracted in 2017, according to GTM Research (GTMR) Senior Solar Analyst Austin Perea. Although tariffs on solar imports did not affect the residential solar market significantly, new state-level policy uncertainties and market forces were major factors as growth dropped 16% below 2016. Growth was also flat in Q1 2018, and the same drivers were expected to continue slowing it through 2020.
An increasingly significant factor in major DPV markets is the dwindling number of "attractive early-adopter customers," according to the 2017 Solar Market Insight report from the Solar Energy Industries Association and GTMR.
This essentially means that one of the premier sources of U.S. solar data and analysis cannot be certain how the DPV market will grow. So how can utility system planners be expected to forecast DPV's impact on their loads?
Solar adoption and DPV planning
LBNL’s "Income Trends of Residential PV Adopters" underscores the challenges facing system planners, according to Research Scientist and co-author Naim Darghouth.
The downward trend in the average income of PV adopters means previous assumptions about PV adoption are shifting, Darghouth told Utility Dive. It adds to the many factors that raise the question of whether growth trends will continue, Darghouth added.
The importance of this growing uncertainty can be found in NREL’s "Estimating the Value of Improved Distributed Photovoltaic Adoption Forecasts for Utility Resource Planning." It shows that costs from misforecasting DPV "can be significant," Research Scientist and lead author Pieter Gagnon told Utility Dive.
"Systematically misforecasting DPV adoption over 15 years increased the present value of utility system costs by up to $7 million per TWh of electricity sales, relative to costs under a perfect forecast," NREL's modeling showed. A large utility’s 10 TWh per year of sales would become $70 million in costs for such "relatively severe misforecasting," NREL reported.
Less misforecasting about DPV growth "might result in a cost of less than $1 million per TWh of electricity sales," the paper acknowledged.
These costs, though large enough to be of concern, are not significant compared to a utility’s overall costs, Gagnon said. But planners might conclude the benefits of more accurate DPV forecasting outweigh the costs.
Forecasting is inherently uncertain, and the magnitude and direction of the uncertainties are influenced by many and variable policy and market drivers that are continuously changing, according to NREL. But better forecasting can eliminate "oversimplifications or misrepresentations of the dynamics underlying customer adoption," it added.
For a utility with limited resources, an educated extrapolation of historical trends can be the most cost-effective way to make near-term forecasts, Gagnon said. "Starting with the historical rate of adoption, projecting that forward, and using intuition and judgment about changes in things like policy, rate structures, and incentive programs could be suitable for choosing the right technology mix."
Larger utilities might do scenario analysis or a probabilistic approach that considers a range of projected DPV adoptions, he said. "But, because of a deficit of data, very few utilities do either."
The impacts of misforecasting vary. "In general, underforecasting DPV tends to increase capital costs but decrease operating costs (relative to a perfect forecast)," the paper reports. "Overforecasting DPV does the opposite."
The utility makes greater capital expenditures than are necessary to overbuild or overbuy utility-scale generation if it underforecasts DPV adoption, Gagnon said. If it overforecasts DPV adoption, it would underprocure generation and incur greater operating expenses. "Utilities will see different incentives in these calculations," he added.
The modeling showed that "for the top utilities, the most sophisticated types of forecasting might be cost-effective," Gagnon said. But "for the vast majority of the 3,000 U.S. utilities, it would not be cost-effective because misforecasting costs would not be high enough."
The paper’s other key conclusion is that all utilities should include DPV projections in their integrated resource plans, Gagnon said. "Completely neglecting it can be very expensive."
The paper includes a new, step-by-step, probabilistic forecasting methodology for estimating the value of improved DPV forecasting, he added. "Every utility is different, but this tool allows planners to walk through the process without any sophisticated modeling or statistics, and end up with a better understanding of their unique circumstances."
Utilities with tools
More sophisticated "bottom-up" planning starts with factors that impact customers' DER adoption decisions, including cost and performance, incentives, rates, peer-effects and demographics, Gagnon said. This "customer adoption modeling" is done by few utilities.
San Diego Gas and Electric (SDG&E) sold 1.2 TWh of electricity in 2017 and, therefore, might benefit from sophisticated forecasting. But it primarily uses California Energy Commission (CEC) forecasts for the Integrated Resource Plan (IRP) required by state regulators, spokesperson Joe Britton emailed Utility Dive. The IRP uses "the CEC load forecast and includes behind-the-meter private rooftop solar."
In 2018, SDG&E also used the LoadSEER software from Integral Analytics, Britton said. Its customer adoption modeling helped the utility address evolving drivers of DPV growth that "make long-term forecasting of private rooftop solar penetration somewhat nebulous." The software "performed as expected," Britton added.
Integral Analytics President Kevin Cushman told Utility Dive last year that LoadSEER maps and forecasts for over 100 intrinsic and extrinsic econometric variables. It is also being used by Pacific Gas and Electric (PG&E), which sold 4.4 TWh of electricity in 2017. Spokesperson Paul Doherty emailed Utility Dive last year that LoadSEER had enhanced forecasting and allocation of distribution-level loads and resources.
Clean Power Research and the Sacramento Municipal Utility District (SMUD) are jointly developing WattPlan Grid, another emerging software tool for customer adoption modeling.
The tool addresses the complications for utilities of DPV forecasting resulting from the growing number of people and technologies involved, Clean Power Research CEO Jeff Ressler told Utility Dive last year.
SMUD, which sold 0.7 TWh of electricity in 2017, is now working with Clean Power Research to implement WattPlan Grid, SMUD executive Patrick McCoy emailed Utility Dive. The utility anticipates a high DPV adoption and the software tool will allow it to better understand the critical way DPV will impact load, according to McCoy.
Two very different utilities
The forecasting tools used by two investor-owned utilities serving large metropolitan regions illustrate how DPV forecasting can have greatly different significance.
Consolidated Edison sold 1.52 TWh in 2017 in its metropolitan New York City service territory. But it is a "delivery company," Steve Wemple, a general manager in ConEd’s Utility of the Future program, told Utility Dive.
"We don’t forecast for the entire distribution system, because that doesn't help us with our distribution capital needs," Wemple said. "We look at the area stations and down into the network, because we use DER as a way to avoid capital investment in distribution system upgrades."
New York’s landmark Reforming the Energy Vision proceeding requires regulated utilities to have a distribution system implementation plan, Wemple said. The plan reports "how we are integrating distributed resources into our forecasting."
ConEd’s DPV forecasting resembles the educated extrapolation of historical trends described by Gagnon. Much of the format has been effective for the utility for a decade. But, in the last two years, it has also begun including very granular data from DPV interconnection applications, through the use of Clean Power Research software.
DPV adoption in ConEd's territory will likely remain low for the foreseeable future because of limited available roof space and open land, Wemple said. DPV "is not a big portion of our load, but it can be an important portion because it can help us avoid traditional distribution system upgrades that would cost hundreds of millions of dollars or more."
The forecasting tools used by Southern California Edison (SCE) are at the opposite end of the spectrum in sophistication and complexity from those used by ConEd.
SCE sold 5.06 TWh of electricity in 2017, putting it among utilities for which advanced forecasting tools would likely be cost-effective. Like SDG&E, SCE works with CEC forecasts, Director of Planning Analysis and Forecasting Mark Nelson told Utility Dive.
But SCE also has its own bottom-up approach, Nelson said. "We have a family of diffusion models that forecasts DPV, using hard to get granular data like household sizes, and even house sizes, at the zip code level," Nelson said. "It also looks at the price of electricity and rate structures."
The tool applies the data to a Bass diffusion curve that identifies stages of adoption, Nelson said. "We don’t know all the factors that impact adoption, but one of the advantages of a diffusion model is that it automatically flattens the curve at a certain number of years out, in anticipation of adoption slowing."
Nelson differed with the NREL paper on two points. "It suggests that overbuying utility-scale generation is a significant capital expenditure, but California has an abundance of renewables and the long-term contract price for them has been falling."
He declined to compare SCE’s costs of utility-scale solar with net metered DPV. But he agreed with Gagnon that different utilities will have different incentives for under- or overforecasting, and added that large-scale renewables should result in lower rates.
He also noted that forecasting accuracy is less critical under California’s two-year planning cycle than under the NREL paper’s hypothetical five-year cycle. "A two-year cycle minimizes impacts of misforecasting because it allows corrections sooner."
NREL’s concern with misforecasting does not mean planning is too complicated, Nelson said. "But we need new models that consider both the supply side and the demand side together and plan for all of it in one pass," he said.
"It will require a lot of data, and will be complex to optimize, and it will run a long time on fast computers," he acknowledged. "But it could look at the behind-the-meter level and at the circuit level, and at large-scale renewables and traditional generation and storage, and it could integrate all of that into the least cost portfolio. That's where we need to go and, hopefully, where we are going."


