The solar sector saw record breaking growth in 2015 and thus far, it appears that growth will carry over through 2016.
That’s according to a joint report from GTM Research and the Solar Energy Industries Association, titled “Solar Market Insight 2015 Q4.” In 2015, the United States solar sector installed 7,260 MW of solar PV in 2015, the largest annual total ever and 16% above 2014.
To further underscore the growth, solar accounted for 29.4% of all new U.S. generation capacity last year, second only to wind and ahead of natural gas, according to a December report from the Federal Energy Regulatory Commission. Of that number, utility-scale solar added 4 GW of new capacity, a 6% gain from 2014.
But to better understand solar’s growth, stakeholders must understand how four key themes are responsible for shaping the solar narrative, according to Cory Honeyman, a senior solar analyst at GTM Research.
These four themes are: time-of-use rates, breakout of community solar, corporate buyers looking to procure green energy and the potential that the current boom will not carry over into 2017.
“All are indirectly or directly in the hands of utilities,” said Honeyman said.
Cost reduction: The great unifier
The unifying factor connecting the four themes is the decreasing cost of solar energy.
“Utility-scale solar will continue to be the primary driver of solar demand but we had the initial glimpses of a non-renewable portfolio standard-driven pipeline and even more cost-competitive prices that we expect to produce an even bigger, record-setting year in 2016,” Honeyman said.
Some factors driving costs down include lowered prices in power purchase agreements (PPAs), a long pipeline of qualifying facilities under the federal Public Utility Regulatory Policies Act (PURPA), and demand from corporations for greener energy.
Prices in power purchase agreements now fall between between $35/MWh and $60/MWh, a value proposition competitive with any source of new generation for utility peak power over the 20-year contract term, the GTM report found.
The low-priced contracts are not unique instances of competitiveness, Honeyman said.
“There is a pretty healthy backlog of utility-scale solar projects looking to get PPAs from utilities,” he said. “ERCOT has an over 10 GW pipeline of utility-scale solar and we project there will be over 1 GW of utility PV installed in Texas.”
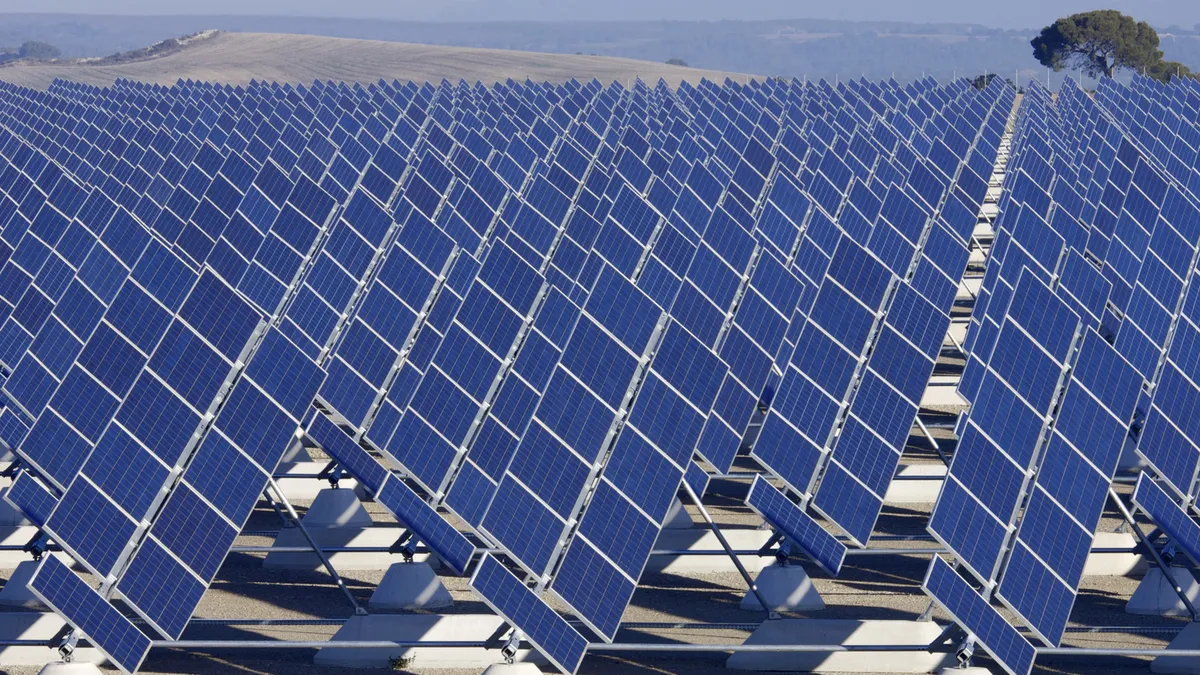
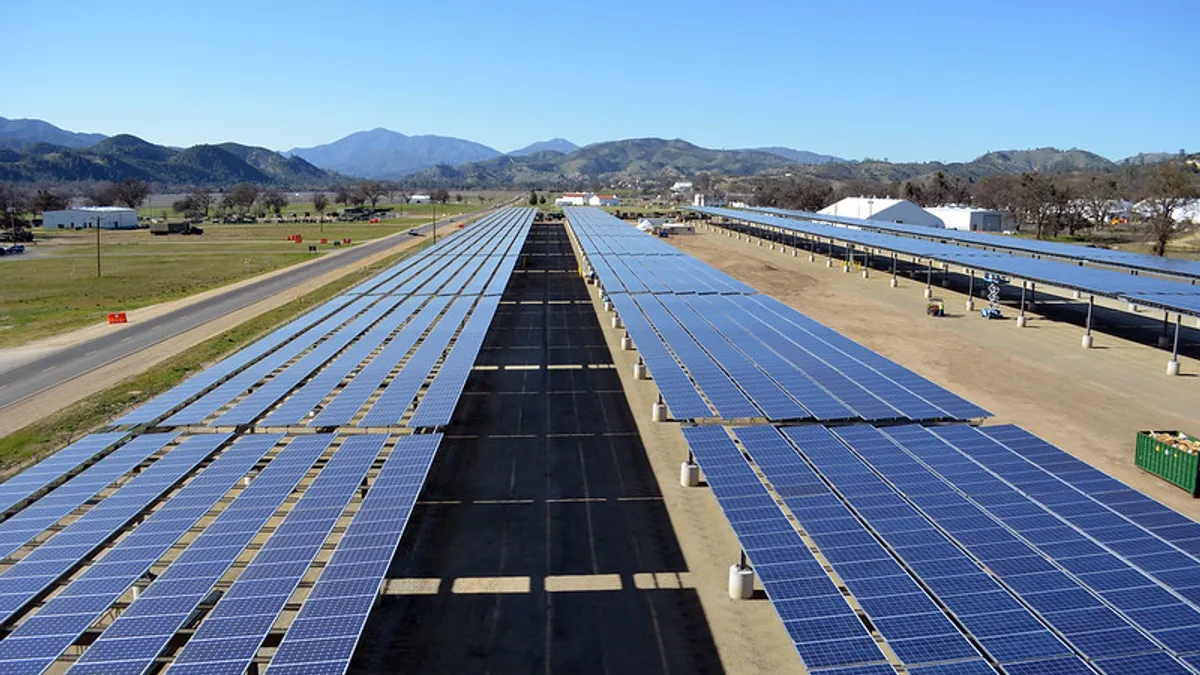
Large solar power plants are part of the drivers behind the United States’ position as the second biggest solar market in the world.
In regions like Texas and the Southeast, utilities are retiring aging coal fleets and replacing them with utility PV, alongside combined-cycle natural gas plants, the report noted. Because of its competitive price, Honeyman said, “utilities are voluntarily bringing large scale solar into their resource planning as a hedge against the price volatility of natural gas.”
And in the Pacific Northwest and Mountain West, solar’s ability to consistently win contracts under PURPA terms by meeting Western utilities avoided cost has created “triple digit MW pipelines,” Honeyman said.
There are currently 2.9 GW of PURPA projects in development — 16% of the utility PV pipeline — and the report forecasts 1.8 GW of that pipeline will come online in 2016.
Another GW of new capacity in 2016 will come from contracts with non-utility off-takers, Honeyman said. Demand from corporations and others for offsite renewable generation will also gather momentum with the advancing price competitiveness of utility-scale solar, he believes.
Time-of-use rates
Honeyman’s first theme for solar growth is how time-of-use rate structures will be the next “hot topic,’ and how they will play a role in supporting substantial growth of solar.
The swift growth of residential and non-residential solar has helped propel national debates over rate reform. Residential solar grew 2,099 MW in 2015, a 66% growth over 2014 and the fourth consecutive year of more than 50% annual growth.
Growing customer demand for solar makes state level policy factors more important. Net metering, solar value, rate structures, and permitting and interconnection barriers are all being hotly contested across the nation, and such debates can create uncertainty for potential solar customers.
In order for time of use (TOU) rates to effectively support a substantial solar market in the absence of retail rate net metering, a solar owner’s peak PV production must align with the high TOU rates at the utility’s periods of peak electricity demand, Honeyman said.
“An example of how it can work is South Carolina,” he said. “Solar is still a blip of a blip in the investor-owned utilities’ electricity mixes, a very low penetration level, so the highest electricity prices should align favorably with the highest solar output, at least in the afternoon hours.”
In Hawaii, however, PV penetration is very high, he said. They have more than adequate solar to fill peak demand in the afternoon. In that case, the commission can set the highest prices for electricity from 4 p.m. to midnight.
“Rooftop solar on its own will not be able to capture those peak prices,” Honeyman said. “It has to add storage.”
The starting point for designing TOU rates has to be peak electricity demand, not what is best for solar, Honeyman acknowledged. In most places solar output and the highest TOU rates should align if they are well-structured in the near term. As PV penetrations rise, there will be challenges for solar, and eventually it will have to be paired with battery storage.
Until penetrations reach that point, utility representatives and solar advocates can find common ground in “smart TOU rate structures that accurately value the role of rooftop solar and allow it to reduce demand when the grid most needs it,” Honeyman said.
“TOU rate structures are one of the important first steps in enabling a smarter grid with a better accounting system for solar’s costs and benefits,” he added.
The state to watch is California, Honeyman believes, which just revised its net metering policy under its NEM 2.0 proceeding.
A little noticed change in its recent NEM 2.0 proceeding requires all solar customers who interconnect under the new tariff rules will fall under TOU rates, which will go into effect toward the end of 2016 for Pacific Gas and Electric and Southern California Edison customers, and early in 2017 for San Diego Gas and Electric, he said.
California’s TOU rates have been solar-friendly but there are questions about whether the state’s new TOU rates will align with grid needs. At the very least, Honeyman expects “it will be a much more complicated landscape.”
Community solar breakout year — or is it?
Utility-scale solar had a record year in 2015 with a new installed capacity of 4,150 MW and more than 19.8 GW in the contracted project pipeline. Driven by construction schedules put in place before it was clear there would be an ITC extension, utility-scale solar installations are likely to nearly triple in 2016, the report forecasts. But as utility-scale solar is expected grow, many industry observers say it’s also community solar’s breakout year — Honeyman’s second key solar theme.
Community solar failed to meet expectations in 2015 because “there were bottlenecks in some major state markets that slowed progress toward realizing the pipelines,” he said.
Objections from Xcel Energy about project size and design slowed progress in Minnesota; price concerns slowed progress in California, and a well-designed policy in Massachusetts went largely unused because of a debate over net metering caps and how they would apply to community solar arrays.
The U.S. community shared solar market was forecasted to add 115 MW in 2015. From then on, the sector was expected to grow at 59% annually, adding a total of 1,800 MW, and be installing at the rate of 500 MW per year by 2020.
The 2015 expectations were supposed to be driven by statewide community solar programs but friction developed in the implementation, Honeyman said. Though utilities were required to participate in community solar programs, they didn’t feel as though they owned them, he said.
With much of that friction eliminated, the 2016 forecast is “over 100 MW of community solar installations,” he said. “Colorado, Massachusetts, and Minnesota alone are expected to add a total of at least 100 MW, with Minnesota leading.”
The bigger question is what community solar installations will look like in the longer term. Joint efforts of prominent players in the solar industry and the community solar sector, like the First Solar and Clean Energy Collective partnership, have shown “not even a glimpse” at the potential of large-scale solar projects that can be repurposed for community purposes, Honeyman said. They also have yet to demonstrate a solution the complexities of customer acquisition, portfolio management, bill credit handling and customer churn. These are questions that will take time to grapple with, Honeyman believes.
“The long term outlook is still strong and is supported by a potential market possibly ten times as big as rooftop solar,” he said. “But in the near term it is important to have sober expectations.”
The majority of growth will be driven by state policy and the minor share by voluntary utility-led programs. Utilities, he said, are actively working on how to design a solar product offering directly to their customers but they are still operating at the level of pilot projects of less than a MW.
At that scale, the economics of soft costs are challenging, he said.
“It is still a chicken and egg problem. If they haven’t done community solar, how do they make the case to their regulators to roll out a big, multi-MW program? But a pilot program will not allow them to understand the costs and benefits of community solar.”
Green tariff program opportunities
Honeyman's third key theme comes from the report’s forecast that at least 1 GW of utility-scale solar will be procured by customers who are not utilities in 2016, he said. This expands a pattern of offsite corporate renewables procurement that has been growing over the past 12 months to 18 months.
“It is a combination of missed opportunities for utilities and opportunities they are participating in,” Honeyman said.
Utilities can seize the opportunity by getting regulatory approval of green tariff programs allowing them to deliver the output of a utility-scale solar project to a large corporate off-taker. If properly designed, the green tariff price is less than the per-kWh price the buyer would pay on the wholesale market, but includes standard infrastructure charges so that it does not shift costs to other ratepayers, Honeyman said.
The NV Energy’s Green Energy Rider program approved for data center operator Switch in Nevada kept about 2% of NV Energy’s load on its system, Honeyman said. It’s one of the most successful examples of a corporate green tariff to date.
Another example is Duke Energy’s Green Source Rider. That program provided green energy for a Google data center in North Carolina and has taken advantage of corporate interest in meeting the company’s ambitious 100% renewables mandate.
Solar*Connect offerings from Xcel Energy in Colorado and Minnesota are newer and more complete evolutions of the concept, according to World Resources Institute Director of Utility Innovation Letha Tawney.
The Switch-NV Energy deal was “an important first step,” Tawney agreed. It proves regulated utilities can work with their customers to deliver new renewable energy.
“But it is a first generation product,” she added. “It doesn’t yet offer the package large buyers need. Utilities, including NV Energy, are working with their customers to create the second generation of green tariffs, like Xcel’s Renew*Connect.”
Other examples of deals between utilities and other corporations are Apple’s contracts with NV Energy and Salt River Project, Amazon Web Services’ deal with Dominion Virginia, and an Equinix contract for the output of a Southern California Edison project.
A different financial arrangement, a “virtual power purchase agreement (PPA),” is being used in the PJM Interconnection and a few other places, Honeyman said.
This involves investing in a “contract for differences,” which is essentially a financial hedge. It allows betting up or down on the electricity price. Through it, the corporate can buy power with some price certainty from a solar or wind project that is sold directly into the wholesale market.
In that case, “utilities are outside the equation,” Honeyman said.
The question in this area, he believes, is whether corporates’ willingness to sign on to more complicated financial power hedge contracts will advance sooner than utilities' ability to roll out regulator-approved green tariff programs that keep those same customers on the grid.
A lot of those financial hedge contracts are very complicated and have very distinct risks, Honeyman said. The green tariff can be a much simpler product. But it has to be designed in a way that is scalable and leads to long term savings because corporates now have another option.
“If the green tariff program is just a one-off design for one corporate, it might not be available at the speed corporates want these opportunities,” Honeyman added.
But it’s not necessarily a binary choice, Tawney said. Some companies have an internal team that can manage the complex financial transactions. Others aren’t comfortable with the hedge or want to prioritize solutions that are on the local grid. For them, green tariffs are an important option.
“We may even begin to see green tariffs that incorporate the market pricing features of the virtual PPAs so companies that want to can have local projects and the market price opportunity,” she said.
Solar ‘reset’ in 2017?
Honeyman's fourth key theme is that the boom in 2016 will lead to a reset in 2017. The 120% year-on-year growth this year will happen because developers who won PPAs in 2014 and 2015 had to make construction plans assuming there would be no ITC extension. Those projects, now in late stage development, will still come online this year and not spill over into 2017.
“It is not that the health of the utility-scale market will fall off in 2017,” Honeyman said. “It is just that there will be a reset after this year because uncertainty about the ITC extension caused demand to be reallocated from 2017 and 2018 to 2016.”
In 2017, despite growth in the residential and non-residential segments, the overall U.S. solar market will drop on annual basis because of reduced utility-scale demand, the report forecasted.
But all three market segments will resume growing in 2018 and, “by 2021, more than half of all states will have over 100 MWdc annual solar markets, bringing cumulative U.S. solar installations above the 100 GWdc mark,” the report concluded.
To take advantage of solar's increasing competitiveness, utility leaders should think first about the solar opportunities that fit their business models, Honeyman said.
A cooperative or municipal utility have procurement and development flexibility that “fits naturally with building out ambitious community solar programs and thinking about a rooftop solar program.”
IOU utility leaders with renewables mandates should notice how cost-competitive utility-scale solar has become. But where there is no mandate, they should recognize how a long-term solar contract with low prices can act as a hedge against volatile natural gas price for decarbonization goals.


